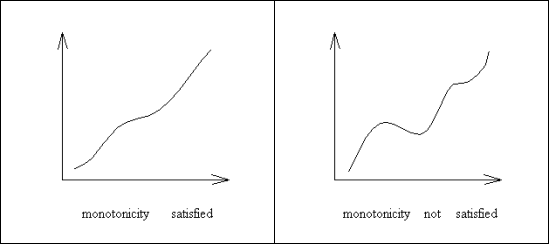
FIGURE 1. Monotonicity constraint
This paper proposes a new framework for presenting information about virtual locations to the users of the World-Wide Web in order to overcome the lost-in-cyberspace syndrome. A method has been developed and implemented to create a representation similar to geographical maps. Toward this end, self-organizing maps (Kohonen neural networks) and a distance matrix method have been used to produce two-dimensional maps with a distance-representing relief structure for regions of the World-Wide Web. The prototype actually permits creation of maps with up to several hundred resources depicted on them, but the method is scalable in its spirit. These maps are dynamic and show the location of the current resource in the map. They also allow you to jump to any resource that has been mapped. They therefore provide a new perception of the space we are navigating. Keywords: geography, lost-in-cyberspace, non-linear dimensionality reduction, self-organizing maps, visualization, World-Wide Web.
The World-Wide Web is the first large scale attempt toward the implementation of the concept of cyberspace. It is a theatre of complex interactions. Just as we can move in our real world, we can wander in cyberspace. This space is multidimensional and therefore seems considerably different from the notions of physical space that many of us have. This multidimensionality makes it very difficult to determine the overall structure of the World-Wide Web. Since information about the orientation is globally poor, the so-called lost-in-cyberspace syndrome has become an important problem, limiting the cyberspace navigability.
Through the ages, geographical maps have been providing a practical way to travel in our expanding world. From handwritten maps to satellite imaging, geography has played a major role in the analysis and in the expansion of human activity. They have become more than practical records of locations, they have given us a perception of space. People are easily able to explore cities and navigate through countries they have never visited before thanks to geographic tools. Despite the fact that a map must distort reality to portray meaningful relationships for a complex world [Monmonier, 1991], they are essential to our continuous expansion. Although the physical earth has been completely mapped, no such maps exist for cyberspace.
Visualization creates the possibility of communicating large amounts of information to the human visual system. If information about an emergent topology of the World-Wide Web can be found, a projection can be built in a dimension appropriate for visualization. It is unlikely that such a projection can provide an exact representation of the scales without any distortion. Therefore, it is important that the mapping preserve at least the essential features of the system.
The project presented here describes how the geographical features of cyberspace can be extracted and visualized. To this end, the following chapters develop a mapping of regions of the World-Wide Web in a medium of low dimension, similarly to geographic maps. A more formal description of the method developed in this paper can be found in [Girardin, 1995]. Moreover, the results, including the documentation of this project, are available at
The first attribute that can be found in usual geographical maps is the scale. Scales rely on the possibility to calculate distances. Although measures with units like kilometres/miles or time are now well-established, possibilities to compute distances within the World-Wide Web have not yet been defined.
We can see the World-Wide Web as a finite set of resources, which are mostly documents. These resources, identified by their Uniform Resources Locators (URLs), usually contain links to other resources. This linkage defines a relation between pairs of linked resources. It is thus possible to model this system with a connected graph where the resources represent the nodes and the links the arcs between nodes of the graph. This easy decomposition technique respects the fundamental organization of the World-Wide Web and takes advantage of its main feature: its non-hierarchical structure.
The distance (dissimilarity) between two resources can be defined by the length of the shortest path between them. This leads to a correct way to define a metric for the World-Wide Web since the triangle (metric) inequality is respected for all triplets. This metric make use of the inherent knowledge contained in the hypertext and hypermedia structure. The quality of this measure will therefore depend on the quality of the linkage.
More complex ways of calculating distances can be easily imagined, for example by using time, traffic, cost or any empirically defined measure.
With the ability to measure the distances among resources, it becomes possible to immerse each resource as a point in a high dimensional space. This immersion provides an interesting way for providing a location to each resource. The distances between relations being relative to the topology of the World-Wide Web; two resources having a direct link will be close and two resources with no relations, even through their neighborhood, will be far away. To this end, a vector is associated with each resource. Each component of the vectors contains then the relative distances to the other resources.
From an adjacency matrix representing the connective structure of the resources, a matrix containing the distance vectors can be constructed by calculating the shortest path to and from every resources. This is done by applying Floyd's algorithm which solves the all-pairs shortest-path problem in O(n3) [Sedgewick, 1989] where n is the number of resources. Therefore, the computational cost can be high if many resources are involved in the process. Note that the bigger the all-pairs shortest-path is, the longer the computation is, since an increase of one of the path length will require one more iteration.
The second attribute that can be found in geographical maps is the projection, which transforms the curved surface into a flat plane. It is clear that a high dimensional space such as the one we created for the World-Wide Web cannot be visualized and thus its dimensionality has to be reduced. To perform this task, a method that preserves the topological relationships of the World-Wide Web conjointly to lowering the dimensionality has to be used. This will create the ability to map any resources onto a lower dimensional space, while maintaining their order of proximity.
Suppose that the central requirement of the transformation is to preserve a monotone relationship between distances. Then only the rank order of the dissimilarities has to be preserved by the transformation. Hence, the metric is abandoned during the mapping and the transformation must therefore obey the monotonicity constraint.

FIGURE 1. Monotonicity constraint
Although popular methods for doing such transformations exist, a fairly new method, the self-organizing map algorithm, has proved to outperform them [Li et al., 1995].
Self-organizing maps [Kohonen, 1995] are inspired from biology. They are designed to behave, for example, like the somatotopic map of the motor nerves and the tonotopic map of the auditory region. The self-organizing map algorithm, first introduced by Kohonen, is an unsupervised (self-organizing) neural network composed of an input layer and a competitive/output neural layer. For our purpose, the most interesting property of this network is that the feature map preserves the topology of stimuli according to their similarity.
We can use self-organizing maps to lower the dimensionality and preserve the topological features of the World-Wide Web. We present the distance vectors (the coordinates of each resource as a point in an n-dimensional space) to the input layer. The neurons in the competitive layer are in fact the possible locations on the map and a weight (reference) vector is associated with them.
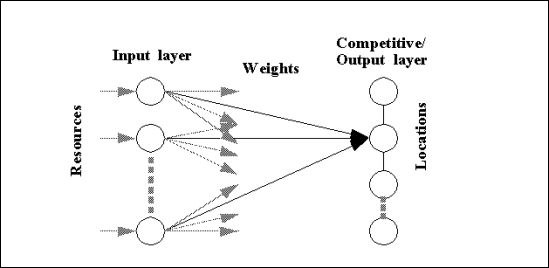
FIGURE 2. Structure of the self-organizing maps neural network
The neural network will iteratively modify the weights to produce a map in the output layer that will exhibit as best as possible the relationship of the topology of the World-Wide Web. For our purpose, each neuron of the output layer represents a given coordinate in a plane. The process does not depend on any prior knowledge of the data and in this sense we can say that it performs a self-organization.
The self-organizing map algorithm in the learning process stage, which consists of a coarse-adjustment pass and a fine adjustment pass, can be summarized as follow:
According to the Euclidean distance between an input vector and a weight vector, a winning neuron is defined as the one which has the closest weight vector. During the learning period, a neighborhood function is defined to activate neurons that are topographically close to the winning neuron. The reference vectors of the neurons surrounding the winner are modified with a monotonically decreasing function. The overall process produces a self-organization so that for two close resources, their images will also be close.
Note that self-organizing maps are performed in a way similar to the k-means algorithm used in statistics. Although, the latter has been shown to perform differently and less satisfactory than the first [Ultsch, 1995].
It must be noted that no proof of convergence of the self-organizing maps algorithm, except for the one-dimensional case, has been presented yet [Kohonen, 1995]. Since the convergence has not been formally proven, we must rely on empirical experiments to determine its computational complexity. It has been shown that the complexity of the algorithm is of the order O(m2n) [Wyler, 1994] with m being the number of output possible locations and n the number of resources. This result in a computational intensive task. It takes more than 24 hours of computation for an initial space of 1,000 dimensions to be mapped on a lattice of 64x64 units. Fortunately, a decomposition into small tasks is possible and a parallel implementation can easily be developed.
Having completed the learning process, the mapping can be processed by calculating the winning neuron for each input distance vector. We have then a mapping function which returns a location on the map for each resource.
Maps use symbols for representing features, places and other locational information. An interesting feature of many maps is relief information which we will use for a special purpose.
Our projection process could have greatly distorted the scale. To enable visualization, a topologically-organized map is therefore not sufficient. The problem resides in the simple fact that only the order of distances among elements are conserved. Thus, we also need a method to visualize the structure of the self-organizing map. This can be done by giving an approximation of the weight vector distribution in the self-organizing map. One method can be used to complete this task: the unified matrix method [Ultsch and Siemon, 1989].
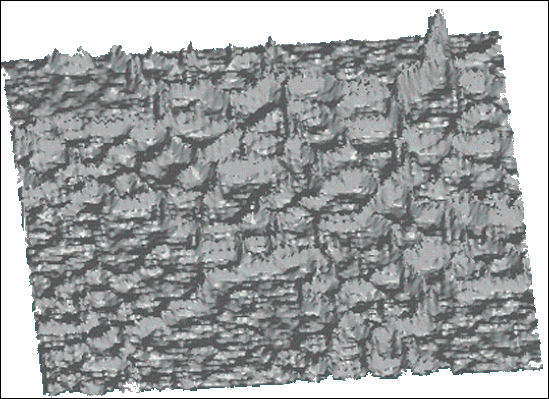
FIGURE 3. Representation of the landscape in 2.5 dimensions
Similarly to geographical maps, this representation provides a way to differentiate the distances between locations. In fact, mountains and ravines have the property of increasing the travels (depending on the mode of transportation), and in the same way can be interpreted on our World-Wide Web landscape. It is possible to depict this landscape on a two-dimensional map using, for example, grayscale values. The darker the relief, the higher (or lower, depending of the interpretation) the elevation. Therefore, two resources that are far in the World-Wide Web and close on map due to the distortion of the projection, will be separated by a mountain or a ravine. The power of this representation can be clearly seen in the possibility it has to provide clustering visualization: similar resources are usually located in valley, which permits a quick way to analyse the various "political" regions of the map. Some other area symbols can be added on the landscape by simply tinting them by hand with different light colours.
The locations of the resources can be draw in the actual prototype using points, crosses or squares. A color is assigned to the "inhabited" locations and its value is determined by some empirical data such as the number of links, the directory level and the clustering level. The clustering level here represents the number of resources that have the same location, as this can occur for really similar resources.
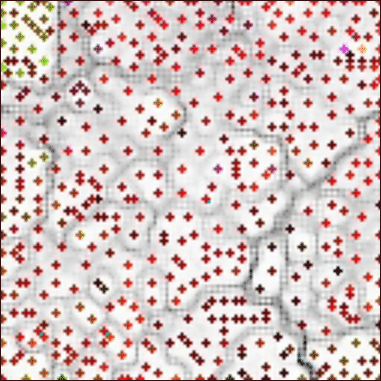
FIGURE 4. A map of various resources in the .ch domain
Although not implemented for this project, an iconic representation of the resources based upon their content or their importance would be easily developed.
A prototype performing the above task has been developed. Using real information about resources available in the World-Wide Web and their connective structure, various maps have been constructed. The visualization, comprising some interaction possibilities, is made available directly on the World-Wide Web using dynamic pictures and sensitive maps, which enable visualization of the user's location and direct retrieval of the resources represented on the maps. Although many maps have been constructed for different parts of the World-Wide Web, one particularly interesting example only is presented.
With the help of our maps, users can conduct explorations in the World-Wide Web according to their various needs. The maps provide the equivalent of a bird's-eye view of the World-Wide Web landscape, such that users can have available a global overview of different areas of interest. The positioning system provides the user with a sense of directionality similar to roadmaps. Through exploration based upon the hypertext structure, the maps also provide to the user a means of understanding distances and, therefore, similarities and differences between World-Wide Web resources. Most notably, through their closeness, users can discover easily similar resources. Finally, the maps can be used for demographic analysis of World-Wide Web servers.
The TecfaMOO (<URL:http://tecfamoo.unige.ch:7777/>) is a WOO (Webbed MOO) system, i.e. a multi-user virtual reality system that combines the power of the World-Wide Web with the flexibility of the MOOs (Multi-user dungeon, Object Oriented). This system provides a programmable interactive environment based on objects that are rooms, characters and all different sorts of artifacts. In a MOO, topology is not just related to rooms. Many other thematic relations exist, i.e. objects that are hold by some person or owned by some person, programs that belong together, people that work together, etc.
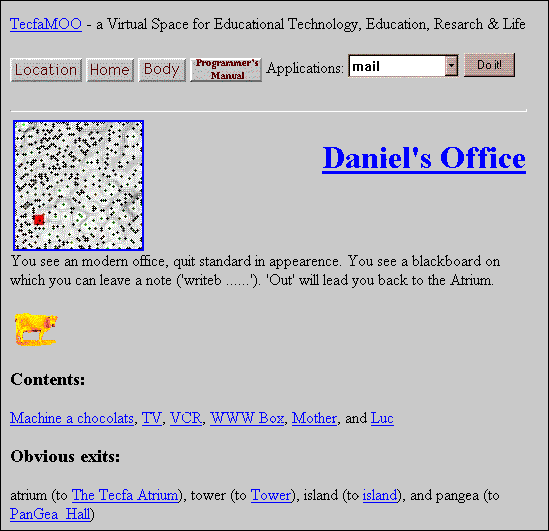
FIGURE 5. Integration of the dynamic map in the TecfaMOO (1,437 resources)
First trials with TecfaMOO have shown that the map, with its ability to show our location (depicted with a red square) and to be teleported to any place on the MOO, is a very valuable tool for users to explore what is "going on" in such a multi-user virtual environment. Geographical topology has been maintained for most clusters of rooms and are only superseded if thematic proximity relations were stronger. Such thematic relations are rooms populated with many artifacts, people working on projects (and holding the generic objects), etc. First user tests have shown the usefulness of the map. Further work will investigate how to build maps for different kinds of relations and objects.
Some ideas for future plans are mentioned below. The list is obviously not exhaustive.
In this work, a simple arbitrary metric is defined to immerse the resources in a high dimensional space. Based on other dissimilarity coefficients or empirical knowledge, a smarter way to calculate the distances between elements could eventually result in a more accurate interpretation of the relationship among resources.
The representation of the resources and of the landscape on the media can be improved in many ways. Making iconic or textual representation of some important locations is certainly a way to improve human-understanding. The use of other values to characterize a resources can also make some important locations emerge. As an alternative to the representation of the landscape, displaying the directions of the weight vectors can result in something similar to the representation of the flow of water in a ocean. Having the locations mapped on a globe can provide a more interesting display, giving the possibility to see a better correspondence with the geography of our planet.
A dimensionality reduction to a space with three dimensions can be achieved using the self-organizing maps algorithm. The problem resides in the way to visualize and interact with it. An attempt to provide this possibility for the World-Wide Web can be found in [Wood et al., 1995].
The user interface of the actual prototype provides limited functionality. To include visual information about already visited locations with a special marking for the location we come from, could greatly improve the navigability. Drawing routes between given locations could also provide some interesting results.
As mentioned in this paper, the most computationally intensive task is the dimensionality reduction made by the self-organizing maps. Fortunately, a parallel implementation of our method can easily be developed. Many references to such implementations can be found in [Kohonen, 1995].
Throughout this work, the visualization of cyberspace as a "common mental geography" has been investigated and illustrated with the World-Wide Web. Just as classical geography is based upon the interaction of atoms, the geography of cyberspace has been built upon the relationships between resources.
Using the topology of the World-Wide Web, a metric has been defined. For this purpose, modelling through graphs has been made and the distances between resources were defined as the shortest path in the graph. This enabled the possibility of representing each resource as a point in a high-dimensional space.
To allow display of the resources interactions placed in a space of high dimensionality, a transformation is required. This transformation has been made by mapping the resources onto low-dimensional visualization media, typically lattices with two dimensions. The constraint made on the mapping was to keep the monotonicity. Thus, only the rank order of the distances are preserved, protecting the most important features of the system.
To perform this non-linear dimensionality reduction, the self-organizing maps algorithm has been shown to provide the best results. The self-organizing maps method is an unsupervised neural network model that produces topology preserving maps.
Since the order of similarity between resources cannot be visualized, we also use a method for representing the reliefs of self-organizing maps, the unified matrix method. By analysing the weight vectors of the self-organizing maps, a representation of the landscape becomes possible. It was then possible to interpret the components of this landscape as being equivalent to mountains, ravines and valleys.
Based upon the above mentioned methods, an experimental prototype has been built. This included a software agent to gather the information, a program to immerse resources in a high dimensional space, the computation of the self-organizing maps to produce maps of low dimensionality, the creation of the unified matrix to represent the reliefs, and the development of a graphical user interface to permit the visualization of the resulting geographical maps and to give the possibility to directly access the resources behind the maps.
The prototype was of academic purpose and various improvements were sketched to improve its usability. The methods used are scalable in their spirit.
The results, made available in the World-Wide Web, were shown to provide an original way to improve cyberspace navigability and to address the lost-in-cyberspace syndrome problem. It is thus encouraged that further research be done in this direction.
I'm indepted to a large number of people who have helped greatly in completing this research. I am especially grateful to Nicolas Droux, Kim Miles, Jennifer Milliken, Lorenz Müller, Daniel K. Schneider, Marielle Schneider and Andrew Wood for their interesting discussions, corrections, suggestions and support.