Posted: March 31st, 2007 | No Comments »
Ratti C, Pulselli R M, Williams S, Frenchman D, 2006, “Mobile Landscapes: using location data from cell phones for urban analysis” Environment and Planning B: Planning and Design 33(5) 727 – 748
In this seminal paper, Carlo Ratti defines the research in the application of Location-Based Services to urban studies. At first he summarizes the state of the art in location determination techniques and their implication related to privacy. Then, he presents the potential from the results of case study in the metropolitan area of Milan, Italy.
In Milan, Ratti explored the way GSM traces can contribute to urban understanding. In a 16 days temporal framework, some patterns could be extracted such as those happening with day/night and working/weekend periodicity. The information gleaned from a urban studies perspectives mainly rely on geovisualizations (e.g. showing the intensity of traffic at a given position in space with thermorgraphy maps). One use could be to infer the “character” of a neighborhood. For example, neighborhoods with high evening and early morning cellphone traffic are likely to have a stronger residential character. An interesting aspect to see the variation in time above maps would be to estimate the flows in and out of the city, such as patterns of daily communities, weekday versus weekend activities, holiday movements.

I could plot something similar with the accuracy used over the time of the day for a specific neighborhood.

Maps showing areas with different cell phone call density in the metropolitan region of Milan. Data between 4 and 8pm.
Relation to my thesis: Ratti mentions that “the pervasive deployment of new technologies is transorming urban patterns, making the more complex and fluid. Greater mobility and freedom are changing the way living and using public and private spaces“. Similarly there is a growing number of data to understand this transformation. Part of my current experiment joins this effort on the use of new technologies to describe cities. That is, how can explicitly geotagged information contribute to urban understanding. I believe it can highlight a number of interesting patterns for tourists and citizens to view a city, such as those happening with day/night and working/weekend periodicity.
This type of investigation based on spatio-temporal traces of people and crowds relate to the work of Raper and Mountain, and Nathan Eagle, as well as for years in Transportation Research.
Posted: March 31st, 2007 | No Comments »
Mountain, D., Raper, J.F., 2001. Modelling human spatio-temporal behaviour: a challenge for location-based services. In: Proc. of the 6th Internat. Conference on GeoComputation. University of Queensland, Brisbane, Australia, 24-26 September 2001.
With the proliferation of location-aware devices large amount of individuals spatial and temporal record of where they have been and when they were there can be stored. This paper describes an number of algorithms for tailoring and analyze accumulated archives of spatio-temporal data generated by location-aware applications. The aim of this work is to produce automated approaches to summarize individual position histories. This helps to derive high level human behaviror from spatio-temporal data such as enclosing rectangles of typical movement and estimates of transportation mode.
Scientist researching the physics of space and time pioneered in the modelling of phenomena against a spatio-temportal framework. Minkowski for example visualised space and time as a light cone defining a boundary between past and future accessible locations.

“All movement must be contained within this region in space-time since nothing can travel faster than the speed of light”. (Rapper 2000) .
Torsten Hägerstrand inspired from Minkowski to theorize “Time Geography“. In this framework, a individual movement can be described as a space-time path whose gradient represents velocity across the 2-dimensional surface. A vertical line represents no movement and increasingly horizontally sloped lines show faster velocities.

Spatial and temporal views
Summarizing spatio-temporal behaviors starts with breaking down the large history of points into discreet temporal sections, each section representing an episode. The key to define episode is finding breakpoints in the data. The main indicators of breackpoints are:
Temporal/spatial jumps, rapid changes in direction/speed, spatial envelopes, temporal envelopes, map display envelopes. The latest being extremely related to my interest in ways to understand and deliver the granularity of location information:
An application of an envelope is holding the bounding coordinates for map display for the real time delivery of an orientation map for a mobile user. The map scale needs to be context sensitive and this can be achieved by assessing the user’s speed and direction. A user travelling at very slow speed, possibly associated with ‘on foot’ or ‘low speed motor’ transport behaviour, will require a high resolution map, displaying minor roads and pedestrian routes, centred on their current location. A user travelling at high speed will require a coarser resolution map, centred ahead of their current location; either a direct extrapolation from their current direction or a more complex algorithm based on the transportation
network.
Relation to my thesis: People are consumer of time and space. A goal of my current experiment is to develop a new data models and forms of analysis to find spatial and temporal trends and patterns based on explicit, user-generated traces (in contrast to GPS or GSM traces). Understanding how people and crowds explicitly consume space could lead to the emergence of types of granularity of location information, as described in this paper by “map display envelopes”.
Posted: March 29th, 2007 | 1 Comment »
Nicolas recently gave a talk at Geoware 2007 on the user experience of location-awareness. He covers some of the topic we have been discussing for some time. In his overview of the problems on the user acceptance of multi-user location-aware applications, he mentions the difficulty to reach a critical mass. Indeed, the hardware and software fragmentation challenge the creation of clusters. He refers to the Metcalfe Law as an example to explain the current lack of value of location-aware applications. In relation to that, I believe that Moore’ Crossing the Chasm can provide an additional perceptive to the problem. Moore believes that in a technology evolution life-cycle visionaries and pragmatists have very different expectations. Therefore, location-aware applications such as Jaiku or Plazes are challenged to rephrase the integration of people’s practices and context to reach a cluster effect.
Besides the usual problems of privacy and limited user interfaces of mobile devices, Nicolas pointed out the misleading quest of seamlessness mainly due to the “roughness” of the world and its infrastructures (in extension to my talk at LIFT). Finally, inspired from both his and my research, he highlighted the difficulty in interpreting the information conveyed by location-aware applications. The problem is threefold. First, automatically giving a position is different that letting people explicitly disclosing their location (as revealing in Nicolas’ CachBob! experiments and in The Error of our Ways: The experience of Self- Reported Position in a Location-Based Game. A user intent is not captured by automated positioning systems. In contrast, explicitly self-reported positions (declarations) can be interpreted as deliberate acts of communication. Second, location information embeds different levels of granularity. As I suggest in my latest paper, Bridging the Social-Technical Gap in Location-Aware Computing as well as in Managing Multiples Spaces, it is a challenge to match the user’s expected granularity of location information with what can a positioning system (or an explicit act from another user) can deliver. I previously intended to model this mismatch. Finally, people have their unique perception of their environment. I became aware of this from Ian White’s talk at IDEA2006 on User-Centered Approach on Geodata and his experience in defining user-perceived neighborhoods. There must be research paper on this topic.

The now classic “infrastructures fail” slide
In response to these problems, Nicolas suggests 5 avenues that we can take as design opportunities to improve the user experience of location-aware application. First, we should think in terms of assistance and not automation (see D.D. Wood’s extensive work on clumsy automation). The idea is to augment awareness, not automate it. In other words, favor a reach presence rather than location. For example, Jaiku (or Plazes SMS) respects the intentionality of the message that is conveyed. By extension, a system should facilitate lies and disconnection. Inspired by Michel Faucault‘s metaphor around the Panopticon, people do not like the feeling to be seen without the ability to see. Second, in opposition to hiding imperfections and limitations, designers should provide the ability to users to perceive and appropriate them. Matthew Chalmers originated this thoughts around the theme of seamful design. Likewise, lately, Don Norman had thoughts on the relation between simplicity and perceived powerfulness. Third, as evoked by our common research papers on CatchBob! or in our article in GeoConnexion, and by Kevin Slavin location information is more than GIS information. That is, location is more than geographical coordinates. It also be whether a user is indoor/outdoor, whether the mobile device can hear a busy street. It is about rich information. A good example is Jabberwocky that allows to see the presence of familiar strangers in the vicinity, anonymized (fitting my Concepts That Go Against the Technological Tide in Social, Mobile and Ubiquitous Computing). Then, history matters: the asynchronous character of location-awareness have an added value and can be used to create conversations after the events (see our current train of thoughts around the usage of data generated by tech in urban environments). By extension, data collected by location-aware systems could reveal the invisible phenomenon (e.g. BioMapping, Real-time Rome, Participatory Urbanism) or create new connection between the physical environments and the digital worlds (see Julian’s talk at LIFT).
Relation to my thesis: This talk is an excellent summary of the many aspects of integration and usage of location-aware application both Nicolas and I have been discussing about. We should try to formalize all this into a Simpliquity white paper. Moreover, it provides food for thoughts to extract a publishable model of mutual location-awareness based on Nicolas’ thesis and my early outcomes.
Posted: March 26th, 2007 | 2 Comments »
The main problem for urban planers, traffic engineers, transport authorities to perform urban modeling is the lack of real mobility data. While car traffic is pretty easy to estimate with sensors (cameras) deployed on the main city crossroads, when there is not “real” data, the only options are to perform in-sitiu surveys or rely on rough estimations (e.g. based on the police estimations). But the resulting picture is often inadequate, expensive—or both. Experiments to automatize the process remains very scarce. For instance, Eamonn O’Neill and Vassilis Kostakos (University of Bath, UK, as part of the Cityware project) presented at Ubicomp last year, a study on the deployment of a Bluetooth scanning system at every key points in Bath (with only 7.5% of the pedestrians carrying a Bluetooth enabled mobile phone). On the other hand, the transportation research has been (painfully) processing logs of vehicles location data generated by GPS embedded in cars. Finally, the market research industry has been trying to guess how many eyeballs pass a billboard by providing panelists with GPS units.
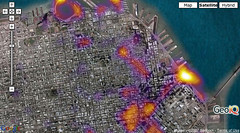
In the recent years, the large deployment of GSM phones generated a massive increase in the volume of spatio-temporal data that can be used to infer individuals or groups spatio-temporal behaviors. The MIT SENSEable City Lab (recently featured in the “E”‘s Technology Quarterly) has pioneered in the visualization of the movement dynamics of cellphone users and has rendered a real-time “pulse of a city” (video). The results take the form of luminous maps adorned with moving and colour-coded arrows, dots and patches of light that indicate the speed and population density of people in the city in question. Other example, IntelliOne developed TrafficAid that identifies congestion in real time by using cell phone location provided by GSM operators. The measurement system processes thousands of device locations per second, “snaps” each device to the road network, and monitors movement for a short period of time. Similarly, Timothy Sohn showed (also at ubicomp06) his mobility mode recognition experiment using everyday GSM traces. He used the logs generated by the everyday lives of three data collectors over a period of one month, yielding an overall average accuracy of 85%, and a daily step count number that reasonably approximates the numbers determined by several commercial pedometers.

MIT’s Real-time Rome: Crowd movement in Rome during the celebration of the World Cup victory.
I perceive 3 main domains of applicability of the processing and visualization of these massively collected personal logs, traces (i.e. history of previous locations)
- Provide urban planners, transport authorities and traffic engineers with data to refine their models of citizens spatio-temporal behaviors. For example, fine-grained “origin-destination” (OD) statistics allow to build more accurate traffic simulation.
- Bring new perspective for decision making and policies building. People-movement maps “will be invaluable” in planning housing and transport.
- Raise awareness and affect the discussion making of individuals or of a crowd. The above-mentioned TrafficAid system is one example. A step beyond, Intel Research Berkeley suggests the idea of Participatory Urbanism, AIR, or BioMapping . This feedback mechanism (urban awareness) is one fascinating aspect of such massive spatio-temporal data collection (this is probably what I would discuss if I get the chance to go to the upFing’07 Villes 2.0 workshop). In fact, Nicolas and I have been discussing quite a bit the use of asynchronous location awareness (traces) tools as a way to highlight social spaces inferred from the traces left in the environment .
Inferring spatio-temporal activities raise several issues that are at the core of my research. First, geographic information systems have limited ability to handle the temporal dimension. Then, the many sources of error and imprecision in the sensed data impact the quality and timeliness of the location data. The visualization might take into consideration the uncertainty in the delivered information (as raised by MacEachren et al in Visualizing Geospatial Information Uncertainty: What We Know and What We Need to Know). Finally, histories of location information mainly render a quantitative understanding of the city.

A visual log of physical presence
I have been with Radio-Frequency (i.e. WiFi and GSM) based positioning and mobility inference for the past 3+ years. Now, I explore a different approach to the collection and analysis of spatio-temporal activities. Based on a first experiment I called (inspired by Scott Smith) Tracing the Vistor’s Eye, I explore the potential of using user-generated geotagged content to infer activities. I have been relying on Flickr geotagged photo to define and confirm patterns of how tourists navigate the urban space (e.g. the elephant path along the Rambla, people do not walk to Gaudi’s Sagrada Familia). I believe that the richness of the collection and analysis of such data is that it carries a higher meaning that x;y;timesptamp location data. Taking, uploading, tagging and geotagging a picture can be interpreted as an act of communication rather than a pure implicit log of physical presence (Inspired by Nicolas’ work on automatic and manual location disclosure and The Error of our Ways: The experience of Self- Reported Position in a Location-Based Game. Therefore, my research agenda for this experiment is to:
- Build a framework that infers spatio-temporal activities in urban spaces based on user-generated content. Use tourists exploring cities as context
- Enrich quantitative spatio-temporal data with qualitative information embedded in images
- Integrate the notions of location information quality and timeliness in the data
- Analyze how Flickr users use the accuracy feature to geotag their images (where, what, when, history of use, overall usage over time). This is to provide a study on the quality of explicitly disclosed location information. In other words, what level of location information quality and timeliness must be delivered in order to be useful and relevant?
- Experiment with ways to visualize this type of spatio-temporal data with its uncertainty. Why not use the InfoScope. Here I aim to explore the parameters that influence successful uncertainty visualization.
- Evaluate the People-movement maps/visualizations. Maybe use the people of Barcelona Ecologia as expert users.
- (would be nice) Evaluate the completion of the “feedback control system”.
I have the core of the framework ready. It processed and generated KML files from test data of Barcelona, San Francisco, and Boston. I plan to collect data from the World’s Most Photographed Cities. As a next step, I will add the sense of origin and destination to visual representation of the traces. Moreover, I will infer the origin of the photographers as of being a tourist or a citizen. Finally, the photos will belong to several temporal categories (e.g. morning/afternoon/night, week day/weekend, special events) and location accuracy categories (e.g. street, neighborhood, city).
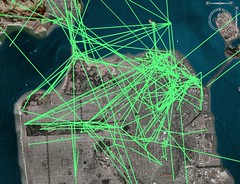
Early experiments with Flickr images taken in San Francisco between March 11 and March 25, 2007). The complete set of screenshots.
Relation to my thesis: I became acquainted of the multiple issues in collecting data collection during my discussions with the urban ecology agency “Barcelona Ecologia”, my readings in transportation research and the design and deployment of GSM-based personal mobility detection systems. This urban computing experiment is the first of the three experiment I plan to investigate my main research questions. It aims at providing clues to my sub-research questions 1) what level of location information quality and timeliness must be delivered in order to be useful and relevant? and 2) what parameters influence successful uncertainty visualization?
Posted: March 23rd, 2007 | No Comments »
Sebrechts, M. M., Cugini, J., Laskowski, S. J., Vasilakis, J., and Miller, M. S. Visualization of search results: A comparative evaluation of text, 2d, and 3d interfaces. In SIGIR (1999), pp. 3–10.
This paper reports on a controlled comparison of text, 2D, and 3D approaches to a set of fairly typical information seeking tasks on a small collection of 100 top ranked documents. The results of this study suggest that reduction of the user mental workload is dependent upon an appropriate mapping among the interface, the task, and the user. For example, there were high interface costs for the 3D visualization, although those costs decreased substantially with experience. In terms of performance, only under the right combination of task, user, and interface did 3D visualization result in performance comparable to functionally matched 2D and textual tools.
Relation to my thesis: I investigate ways to visualizing location information and try to understand the relevance of the emergence of 3D representations of the urban space (Google Earth Berlin, Barcelona 3D). We know how to build 3D model and we now have tools to deliver them, but then what…? Visualization techniques derives in a large part form their ability to reduce mental workload. Is it really the case for 3D visualizations of urban spaces? Therefore, what types of location information are more relevant in text, 2D or 3D. What tasks are better solved? What mental workload is necessary over time? This paper provides some answers in the domain of information search, highlighting the cost of 3D that then decreases substantially with the experience.
Posted: March 23rd, 2007 | No Comments »
In 2004, DTI Global Watch Missions enabled small groups of UK experts to visit leading japanese technology organisations to learn vital lessons about innovation and its implementation of benefit to in the field of LBS. They came back with the report Location-based services: understanding the Japanese experience to provide implication for the UK LBS market. The report is divided into eight chapters such as LBS used in Japan, the importance of emergency location and privacy, Mapping and QR codes, Handset manufacturers, operators. In brief, the findings limits to adoption of A-GPS enabled handsets, emergency location policies and the upcoming Satellite-based augmentation systems (SBAS).
Relation to my thesis: Besides, the clear lack of a user-centered perspective (people habits, context of use, cultural differences), the reports states the hype around the use of LBS in Japan: “the GPS enabled LBS market in Japan has taken off, but not to the extent reported by some of the western press“. I sometimes also here this skepticism at Mobile Monday events. I guess I will need to see it for myself to define what is hype and what is reality. Some recommendations of the report (IMOHO rather naively reported) highlights some issues my work touches:
“The user experience of A-GPS positioning systems is that the accuracy is good enough, but the main criticism remains the time taken to get the first position fix.”
“Look towards having ‘hybrid’ positioning solutions, to provide some level of positioning in the absence of GPS”
Finally, the conclusion that “To date, the revenues to the operators and content suppliers are relatively low in comparison with that from LBS services that use lower accuracy network-based positioning, but growing” might support my approach on the mismatch between the expected and delivered location information quality and timeliness (as I intended to model a couple of months ago).
Posted: March 20th, 2007 | No Comments »
The next MobileMonday Barcelona event “Mobile Gaming and Beyond” (Monday, April 2, 7pm, Auditorium of the UPF) will discuss the current state of the mobile gaming industry and present the new opportunties and challenges that lay ahead. It is my pleasure to invite Nicolas Nova and Maarten Noyons (Managing Director, International Mobile Gaming Awards) to share their experience and (provoking) visions in the field of mobile gaming. Ignacio Cavero CEO of LemonQuest and Marta Vieira, Head of Entertaiment Division at YDreams, will complete panel. The introduction to the topic is as follow:
Currently, the mobile game market is highly dominated by games that have an easy gameplay, few simple rules and do not require special skills to enjoy. These games are mostly clones of successful casual games such as Minesweeper or Tetris.
However, the future of mobile gaming seems to rely on new types of gameplays that embed the new capabilities of mobile phones to sense their context. Like the newly released and successful Wiimote, mobile devices become sensitive to movements (e.g. Nokia N5500), engaging players to physically move as part of the gameplay. In addition, the emergence near-field communication (RFID, Bluetooth, QR codes) and location-aware technologies enable new types of scenarios that link virtual worlds with the players’ physical surroundings. For example, multi-player location-based games played out on city streets and built up urban environments.
The increasing contextual and proximity awareness of mobile devices provide new opportunities for players to engage in collaborative or competitive game settings. In contrast to this pretty picture, many issues such as the operators walled gardens, the size of the screens, network quality and coverage as well as the processing power of the mobile phone challenge the development and deployment of these new types of games. Finally, the economic future: who is going to pick up the fragmentation and the distribution challenge? Where is the 8 billion mobile gaming market?
Posted: March 16th, 2007 | 2 Comments »
Ykä Huhtala and Jussi Kaasinen of Nokia Research recently offered for free download their Nokia Sports Tracker for S60 3rd edition phones. Nokia Sports Tracker uses a Bluetooth GPS device or an integrated GPSis a GPS based activity tracker that runs on S60 smartphones. Information such as speed, distance and time are automatically stored to your training diary.


I programmed a similar application in S60 Python a while ago. However I rapidly got annoyed by several things:
- the need to find an place to get good visibility to satellites for the GPS to warm-up and start running
- while running, the phone would sometimes lose the Bluetooth connection to the GPS without being able to automatically reconnect (possibly a S60 Python issue)
- I would often run in forests where I would get bad or no GPS signal impacting the measured distance.
- Wearing a mobile phone + GPS unit while running is a pain (e.g. straps that get loose).
- I ended up taking phone calls or reading/writing SMSs…
Relation to my thesis: There is a real interest in logging personal mobility and activity (i.e. traces) for health (pedometers, BioMapping, Nokia Sports Tracks, Nike+iPod) or social (Jaiku, Marc Hottinger’s dataSpaces) purposes. Such applications can provide valuable self-awareness and replay tools (such as in persuasive or healthcare systems). However, beyond the privacy and ethic issues, the way to integrate them in our daily lives, collect data and way to deliver them in a meaningful way is still at its infancy.

Courtesy of Bio Mapping
Posted: March 15th, 2007 | 1 Comment »
In the same time as a Google Earth 3D version of Berlin was announced last week, the spanish company QDQ Media opened the doors to its Barcelona in 3D project. The 3D model seems rather old, as neither my home nor the Torre Agbar appear.


Relation to my thesis: Beyond the revival of 3D environments, what type of location and proximity information are beneficial to view in 3D? The paper Taxonomy for Visualizing Location-Based Information sets an resourceful base for further work on that matter. In addition, what information are sensitive to temporality of the map? In the case of Barcelona in 3D, the model is 5 or more years old and the shot of my house was done in the middle of the afternoon in Winter according to the shape of the shadows.


