Posted: March 17th, 2008 | 3 Comments »
In the processing of building a coherent story around my research endeavors and considering potential outcome, I have returned to exploring how agent-based modeling techniques can help grapple with the validation and significance of user-genereated content in the realm of urban/mobility/tourist research. Current tourism simulation and modeling (see for instance TourSim) works mainly rely on specific surveys to build and evaluation the simulation. In addition, the data collected describe tourist behaviour such as spending habits, and psychological motivations for tourism. These sparse information make it hard to reflect the complexities of tourist behavior and build effective and efficient decision support tools to assess planning decisions. What is required for recreation planning, is verification of how tourists act spatially at recreation sites. However key variables such as the speed of tourist travel, wayfinding decisions, crowd avoidance, and other spatial behaviour, are not yet well understood to model the tourist visiting a city. One of my hypothesis is that digital footprints such as user-generated content can help develop agent-based models and simulations of tourist flows and movements (in that case through photography).
Similar to transport research, some tourist research collect quantitative data of tourist activity such walking and photography. In Building better agents: Geo-temporal tracking and analysis of tourist behavior the authors use quantitative data captured by sensors to build agent-based models of tourist behaviors. Their simulation provide one way for managers to accurately predict future impacts, and their spatial patterns of the develop of certain tourist areas. They analyze:
- detailed visitor counts
- average trip durations
- tourist behavior
- spatial patterns of movement
in order to reveal some group and individual behaviors:
Crowding: Determing through correlation whether people were spending less time, for example, on the viewing platform, during more crowded times of the day.
Graphing: Provide detailed information about times and sequences of travel for individuals and groups
Travel time: Time frequency distribution to be analyzed. Correlation between time spent in various area of the study site
Travel sequence: Tourist behavior can be devided into distinguishable groups based on movement sequences
However, the overall validity of the simulations remains uncertain without detailed calibration data. As described in Understanding of tourist dynamics from explicitly disclosed location information, the flickr dataset can provide more coarse grained quantitative observations of similar phenomenon. However, user-generated data can surpass the scalability and time constraints of surveys and sensor-based approaches. My current believe is that the availability of data over the world’s most photographed cities can allow me to validate tourist models build from user-generated content. Building such a model and validate it with simulation over several cities might be one nice outcome.
Next steps in that direction, Michael Batty wrote a book on Cities and Complexity: Understanding Cities with Cellular Automata, Agent-Based Models, and Fractals. Repast Simphony 1.0 has recently been released which includes a point and click interface for model development and full GIS support.
Posted: March 12th, 2008 | No Comments »
In a discussion at the MIT Responsive Ctiy meeting with Prof. Nigel H.M. Wilson who presented current research in the analysis of real-time transportation data for understanding users behaviors, the question was raised to know why these data where not massively used nowadays (related to what Christopher Zegras discussed last week). Many transportation agencies still rely on expensive surveys with a limited statistical significance and overlook large automatically collected data their system provide. Nigel answered that first, these agencies want to make sure these data bring at least the same amount of knowledge than their “manual” data (e.g. surveys). Second, they do not necessarly have the skills and knowledge to analyze and grasp the significance of these data (which is my feeling when it comes to Bicing or Velib usage data). We seem to be in a chicken and egg situation here. Finally, there is a people concern that these data will be used to their detriment. For instance, it could reveal that the number of routes in certain areas should be decreased, or that user could wait longer for connexions. In other words, these data do not always lead to positive and favorable decisions for certain users.
Relation to my thesis: A major issue in leveraging people generated content to reveal new aspects of the city is about validating and proving the significance of these data with already existing analysis techniques.
Posted: March 11th, 2008 | No Comments »
The meeting to report on my first results on tourist activities in Florence provided the opportunity to further plan my year at the MIT SENSEable City Lab. Prior to moving here, I extracted the keywords of my research: feedback loop, manual location disclosure, digital traces, granularity, uncertainty and co-evolution. Instead of finding complete coherence, its seems that now the completion of my thesis could take two separate avenues each related to some of these keywords:
Leveraging digital traces
In the first, I can build further upon the Tracing the Visitor’s Eye project and consider the analysis of digital traces or volunteer generated information to understand how they can be helpful to tourism (or more in general mobility?) and support decision making. It could be about forging new ways to describe tourism with a validation through second order analysis with other dynamic data such as cellphone data (flickr 70% and 30% cellphone data). Analysis could take place in Florence or Rome (better for statistical validity). Part of the analysis would focus on the accuracy of the data at hand and highlight the shortcomings and potentials. It would be about how flickr users (and maybe another dataset) describe the space (semantic analysis of the flickr dataset). The outcome would be a set of interactive tools and visualization to analyze the data and why not a model that could simulate the mobility of tourist from the flickr and cellphone datasets.
Research questions: How digital traces (or in a narrower way “volunteer generated information”) can enhance current tourism (or in a more extended way mobility) observations? With potential sub-questions as follow:
- What new information on mobility and tourism do these data bring? -> traces, scalability, richness of the explicit act of disclosing information, peope-defined area of influence of points of interests, people’s area of attention (digital footprints to improve the virtual representation of the space), geographic relevance
- How can we validate these data? -> use techniques to calibrate the flickr dataset with other mobility databases.
- What are the data quality (accuracy, noise, …) issues in volunteer generated information? This would be about revealing some factors that influence people’s decisions when they georeference information. ->In addition to Flickr data, I could setup a field experiment in Florence or as part of the WikiCity Rome project.
- How does automatic positioning influences location disclosure? Retrieve users who georeference automatically and study the semantic descriptions they use to disclose the information.
- How to visualize uncertain location information? This might involve setting-up an experiment with practitioners in urbanism/tourism or observe their current practices.
The appropriation of location information
The second avenue aims at building a coherence (a story) from the outcomes of CatchBob! and my taxi driver study and the semantic analysis of the flickr dataset. The main theme/question would be to better understand how do people relate to space (and its multiple spaces) through location information with a set of evidences each study would bring. CatchBob! indicated that technologies representation of the physical environment is uneven and fluctuant leading to feelings of uncertainty. Observations of taxi drivers revealed the importance of the prior experience of the space to appropriate a satnav system and the pitfalls of the discrepancies revealed in CatchBob!. In addition, current satnav systems do not fully support the practices of taxi drivers who need to access different levels of granularity of location information during a journey (trunked access to the information as if it was process through a funnel). This is for the reading/accessing part of location information. So what happens when we let people write and describe space. How does that translate to the different levels of granularity of multiple spaces (spatial semantics)? The semantic analysis of the flickr dataset could help understand how people manage multiple space. I could add a field study in Florence to bring another perspective to that question. The outcome of this research avenue could consist in a list of evidences revealing the issues around the granularity of information, a tool to study people-generated content. The sub-questions could be:
- What factors influence uncertainty in the use of a location-aware application? How is that related to the management of granularity and the reference to multiple spaces?
- What are the influence of automatic positioning on the the practice of manual location disclosure?
- How can people-generated content help define multiple spaces and different levels of granularity?
- …
Relation to my thesis: Avenues to discuss with my advisor, then take a decision, stick to it, trim and polish the research plan. I would love to integrate some of the velib and bicing data analysis to any research avenue, but it seems that for the moment it will stay as a parallel (fun) research endeavor.
Posted: March 9th, 2008 | No Comments »
Karen Martin drew a very compelling map of the field of Urban Computing (a name nobody seems comfortable with. I guess we have to live with it until the restrictive term “computing” gets replaced).

Relation to my thesis: An excellent attempt to delimitate the field. With my perspective, Geography/Cartography might be missing in this picture. As well as sensors, data mining and agent-based modeling could added to Computer Science and Information Visualization to the HCI potato.
Posted: March 8th, 2008 | No Comments »
Now that the Internet becomes ubiquitous in space, it might affect its availability in time.
Posted: March 5th, 2008 | No Comments »
Neogeography met e-Social Sciences last month at the Digital Geography in a Web 2.0 World Day organized by CASA,UCL and NCeSS. The slides of the presentations are now online.
Posted: March 4th, 2008 | 1 Comment »
Hardey, M. (2007). The city in the age of web 2.0 a new synergistic relationship between place and people. Information, Communication & Society, 10(6):867 – 884.
In this paper Michael Hardey examines how the development of Web 2.0 resources is providing new ways of seeing, experiencing and understanding the city. A particular focus is on the increasing role of user-generated geolocational data and the opportunities this affords to reimagine and experience the metropolis with mobile technologies acting as a conduit. It considers the raise of ‘citizen media’ and ‘new cartography’ as ways to map and visualize the city through images and narrative descriptions. These new services of the city might help people base a decision about whether or not to move home. It could be informing long-term choices such as deciding where to live or what school children should attend, and the more everyday such as which park or shop to visit may be shaped by a mesh of user-generated and other data.
Michael Hardey describes this emergence of digital traces in the city and the feedback loop they generate as follow:
As Sheller and Urry (2003) observe, ‘individuals increasingly exist beyond their private bodies. Persons leave traces of their selves in informational space, and can be more readily mobile through space’ (p. 116). Indeed users of social networking sites may always be immersed within them, as they and others are dynamically geolocated. This marks the emergence of new ways of experiencing and living in the city as people make nuanced choices about places to avoid, visit, live or work. Such choices can be increasingly fleeting, unplanned and dynamic as mobile technologies deliver personalized data about places and people. There is a potential rapid feedback loop here as locations in the city may experience sudden flows of visitors or customers as people follow lines of information or seek the presence of those from their social networks.
Relation to my thesis: This text consolidates well the claims supported so far in Tracing the Visitor’s Eye. However, I am rather dubious about the wisdom of citizen media to support decision making in the city. As explained in I rather believe in the richness of implicit traces people leave in using web 2.0 and mobile systems to understand the city and places as expressed in Leveraging Urban Digital Footprints with Social Navigation and Seamful Design
Posted: March 1st, 2008 | No Comments »
Via Anne Galloway.
Crang, M. and Graham, S. (2007). SEntient cities ambient intelligence and the politics of urban space. Information, Communication & Society, 10(6):789–817.
Mike Crang and Stephen Graham deliver a “British cultural geography” approach (see also Dodge and Kitchin’s Code/Space) to urban ubiquitous computing far from the contemporary techno-determinism and well attuned to socio-cultural nuances and the variety and complexity of everyday lived experience (see Concepts That Go Against the Technological Tide in Social, Mobile and Ubiquitous Computing). In this article, they explore domains within which the reconfiguration of cities and their politics are being actively imagined and enacted through the imagination and deployment of ubiquitous computing. Through a wide-ranging survey they emphasize that there is a great deal of work going on developing and exploring urban pervasive in three main domains: “commercial fantasies of ‘friction-free’ urban consumption; military and security industry attempts to mobilize ubiquitous computing for the ‘war on terror’; and attempts by artists to interrupt fantasies of perfect urban control through artistic use of new ubicomp technologies to try and re-enchant urban space and urban life.” Strangely enough, I do not really understand why research endeavors to explore urban informatics are not discussed (such as investigating the significance of digital traces, use of urban probes, study of the co-evolution
They categorize the latter domain (digital art and locative media) into three main types of initiatives:
- The first take the data coding of the environment and seek to make it transparent and/or aesthetically problematic.
- The second are those that seek to re-enchant the environment through multi-authored overcodings. That is they take augmented space but seek to pluralize the authorship.
- The third are those that seek to foster new engagements with the environment by promoting new practices of direct contact and association
The critique of a possible future of the perfect, uniform informational landscape and the fantasies of ‘friction free’ urban consumption matches very well with the message of Sliding Friction. They refere to Michel de Certeau:
His nightmare city was one of perfect knowledge and transparency where terror is no longer about the shadows but ‘an implacable light that produces this urban text without obscurities, which is created by a technocratic power everywhere and which puts the city-dweller under control.
[...]
Far from the pure vision of what de Certeau calls the ‘concept city’, we may find the production of myriads of little stories – a messy infinity of ‘Little Brothers’ rather than one omniscient ‘Big’ Brother
and Malcoml McCullough’s Digital Ground
In practice, we may find that temporary and ‘good-enough’ approaches to urban ubicomp may lead to ‘local aggregations of self-connecting systems [that] can become islands of coherence in the chaos raised by pervasive computing’.
It matches also quiet well with what I attended to communicate at Lift07 in Embracing the Real World’s Messiness.
But they are only mythologies of a perfect, uniform informational landscape. In reality, the seamless and ubiquitous process of pure urban transparency that many accounts suggest will always be little but a fantasy. In practice, the linking of many layers of computerized technology is generally a ‘kludge’, as software designers call it. That is, a bricolage of component middleware, none of which is really designed for the task to which it is put, nor perfectly configured to work with the other middleware or devices it encounters. Computerized systems thus run ‘sub-optimally’ but normally function adequately nonetheless.
[...]
There is a real issue about proliferating knowledges circulating routinely and more or less autonomously of people. But it would seem to us that the political options are not those of rejection or romanticizing notions of disconnection. Rather, it is to work through the inevitable granularity and gaps within these systems, to find the new shadows and opacities that they produce.
And finally I share the same discourse whenever I have to answer the “Big Brother” question for Tracing the Visitor’s Eye:
As such, there may well be an issue where rendering our tacit sociospatial practices visible is an uncomfortably close echo of commodified and surveillant systems. But these artistic endeavours in turn offer a second politics of visibility, that is these technologies themselves need to be made visible.
Posted: February 28th, 2008 | No Comments »
As part of the Responsive City Initiative at MIT, Christopher Zegras presented a state of the use of digital technologies to shape the future of urban transportation planning. Current research threads in the domain focus on sensing and planning activities, movements, morphology, infrastructure and energy, yet there is lack of common platform. Simulation and forecasting are the main analytical methods. Yet the field is mainly driven by the private sector to the point of questioning the role of academic research. The big players include (in the US and UK):
- Inrix: a data provider from stationary sources, toll systems, 650,000 vehicule probes. They then clean and fuse the data and sell them to TomTom, Garmin, dash.
- Navteq – Traffic.com: road sensor network (biggest in the US) – One big issue is that, in some cases, these companies contractually own the data, that become inaccessible to study.
- ITIS Holdings and TrafficMaster (cctv, fixed sensors, probes)
- TomTom Mobility Solutions: celphone vehicule tracking (with Vodafone) project from next year 7mio phones they get their information from
- TeleAtlas
- Traffic from cellphone triangulation: IntelliOne, AirSage, CellInt
- Public transportation real-time transit information and schedules: hopstop, transloc, mybus, nextbus, Google
- Energy: Carbon Hero that calculates carbon footprints
These multiple market-driven actions leave governments way behind the curve. For instance, the many data used for planning the future of Boston were collected in 1991 (!). Similarly, Los Angeles owns one of the widest network of road sensors. Yet these data are only use to master the the real-time dynamics of the infrastructure and then thrown to the garbage. The archives are not used to improve the system (!). In other situations, governments delegate the efforts the private sector and lose control of the data. So what is the role for academic research here? Maybe to shade light on the privacy issues, provide a more holistic view on this ecosystem, understand the implications for governance? Before transport planning was about predict and accommodate and it become more observe and improve. In that perspective, a research avenue deals with user innovation and understand the implications for governance. As WikiCity aims to explore: how do we empower customers of transport systems and give them back real-time, mobile ubiquitous data? Similar to what TomTom MapShare does by letting users modify and share maps.
Relation to my thesis: Understanding the current state of the implication of real-time data for urban transportation planning. Interestingly there is now a focus on volunteer generated data and their implications as well as understanding how sensor data can be disseminated into our practices (problem of their granularity was mentioned, how solution satisfy lifestyles and preferences (such as the new ride sharing services) but also techniques to evaluate the viability of these solutions.
Posted: February 27th, 2008 | 1 Comment »
In parallel to my current senseable activities, I took some hours to build a follow-up to my work on Bicing and extend it to the Paris Velib’ system. For that purpose, Mathieu Arnold kindly granted me access to a large Velib’ dataset he has been accumulating over the past months. The potential of the archived and real-time data of the 900+ stations could actually lead to a nice little project on revealing the city through the citizen’s use of Velib’.
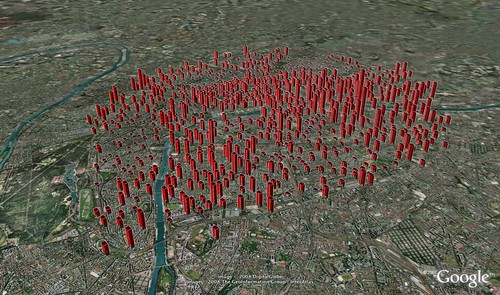
First mapping of the Velib’ data. Average number of bikes available at each station on February 10.
The video is available in the Revealing Paris Through Vélib’ Data page.