Posted: May 6th, 2007 | 1 Comment »
Thierry Joliveau has performed a very detailed inventory of the spatial and location-aware applications featured in the TV Serie 24. In Essai d’inventaire des techniques géonumériques dans 24 heures chrono lists the techniques and devices used. I intended to categorize them as (screenshots courtesy of Thierry Joliveau):
Data capture and visualization
GSM positioning, GPS enabled pedestrian navigation system, GPS enabled car navigation system, RFID positioning, car plate detection by highway CCTV, remote tracking of a GPS enabled cellphone, locate a building with thermal scanner, tracking a helicopter fleet, suspect tracking with bank transactions


Mobile use
Download of a map onto a PDA, download of a satellite image onto a PDA, download of a map onto a cellphone, transfer of coordinated onto a PDA, transfer of spatial data onto a TabletPC


Geodata analysis
Real-time observation of satellite images, spatial analysis to locate a cellphone, visualization by satellite with infrared sensor


Interestingly some scenes feature the limitations of the technologies (here it takes time for a GPS to get a fix).

Relation to my thesis: Beyond arguing if these examples are technically feasible, I am interested to see how the types of location information and visualizations the characters of 24 Hours use to get a sense of space in an unknown (unfriendly) environment. Most of the spatial coordination seems to happen over a cellphone with somebody in a control room feeding the dispatched agents.
In a foresight approach, a more detailed analysis could lead to a reflection on our visions of location-aware systems and what leads us to these visions. Frédéric Kaplan performed this type of extended analysis of the visions of the past to understand the future in Futurs 2.0 : La société transparente, utopie du 21e siècle ?
Posted: May 5th, 2007 | No Comments »
Posted: May 5th, 2007 | No Comments »
I could not attend the CHI workshop on Mobile Spatial Interaction, but luckily I bumped into the (co-)organizer Peter Fröhlich, as well as participants Will Seager and Zach Toups whos work closely relate to mine.
Will Seager, and Danae Stanton Fraser, User responses to GPS positioning information on a digital map
This paper contributes to demonstrate the need of transparent position carrying the notion of uncertainty in the data. The field study involving a pedestrian navigation task, positioning information supplied by GPS seemed too inaccurate to be useful. Worst still, the inaccuracy could confuse users, especially since the position icons used in commercial products typically give no indication of the degree of uncertainty. One solution to the issue of uncertainty would be to convey the level of certainty to user. If the GPS unit provides sufficient information to estimate the level of inaccuracy, this could be reflected in the position icon e.g. a transparent position icon that grows or shrinks depending on the level of accuracy.
Zachary O. Toups, and Andruid Kerne, Location-Aware Augmented Reality Gaming for Emergency Response Education: Concepts and Development
This paper presents the location-aware game Rogue Signals, deployed to enhance the team coordination skills of participants. The authors relied on an ethnography of fire emergency response practice to inform the design of the game. The study revealed design implications based on building coordinations skills such as leveraging information differential, mixed communication modalities, and utilizing audible clues.
Apparently, I missed Morten Fjeld who presented 3DVN: A Mixed Reality Platform for Mobile Navigation Assistance.
Posted: April 30th, 2007 | No Comments »
The Imaging the City workshop here at CHI featured a nice set of practices and technologies for representing the urban environment in Human-Computer Interaction. Some of them are strongly related to my current work.
Urban Ritual in Rome: Characterizing the City with High-Resolution Cell Phone Data by Matthew Jull and Carlo Ratti is a follow-up on their work with Real-time rome. Their spatio-temporal analysis show that cell phone activity correlates strongly with the infrastructures and zones of the city (e.g., transportation links, commercial, office, residential zones) and the daily activities (e.g. wake up, commute, work, lunch, dinner, sleep, sports events). These preliminary results suggest that cell phone data can be used to characterize and map urban domains and the cultural signature of its occupants.

The daily activity of people throughout the city is revealed (i.e. wake up, commute, work, lunch, dinner, sleep, sports events etc.)
Personalized City by Continuous Location Logging by Jun Rekimoto and Takashi Miyaki. They propose a city visualization method based on long-term and continuous personal location history generated by WiFi-based location detection methods. Their visualization reveals a person’s “cognitive” map based on the traces left while navigating the urban space. They apply a fisheye-view method to distord the map in order o reflect the person’s location probability density. Therefore, frequently visited area becomes larger on the map. The continuous log of one’s geographical position could be a foundation for various “lifelog” applications, such as memory aid or information organizer (as suggested in Tracing Personal Mobility).

A nice comparison of WiFi in GPS location accuracy in a urban setting

Person’s “cognitive” map based on location history. Fisheye-view to reflect the person’s location probability density. Frequently visited area becomes larger on the map. To be useful in a local search task, it might be more useful to distort the map to reveal the less know areas. I have this experiment using anamorphosis maps in mind for a while now…
How We Watch the City: Popularity and Online Mapsi by Danyel Fisher. He developed Hotmap, a tool that visualizes how people have used Microsoft’s maps.live.com to reveal what parts of the maps they find most compelling. The results show that the vast majority of hits are focused on a fairly small area, following population, suggesting that largely, users currently find use of the tools for looking at natural scenery less compelling then they do city imagery. This work could be extended by show how people “query the city” (e.g. what are the keywords. Something I wanted to find out more about at Urban Mapping). Knowing more about the types of searches and the areas of interests could help the local search community to go beyond the classic, yet irrelevant “closest Starbucks” scenario. Categorizing the different types of granularity in space and time embedded in the queries could help understand how people query space.

The Big Picture: Exploring Cities through Georeferenced Images and RDF Shared Metadata, by Carlo Torniai, Steve Battle and Steve Cayzer. They present a prototype system by on Flickr geotagged images to discover geo-related pictures of a same city taken from different users. The browsing interface, based on different levels of relationship between pictures metadata, allows users to explore cities according to the relations discovered. An extension of the work can be found in Sharing, Discovering and Browsing Geotagged Pictures on the Web”.
Posted: April 28th, 2007 | 2 Comments »
Ian White was kind enough to invite me present my research at today’s Urban Mapping brown bag seminar.

Thanks for the gig, Ian! It is extremely valuable to get insights from people in the field doing real business with geodata. Subsequent to my presentation we discussed the current state of local search and the difficulties to integrate a user-centered perspective. In the generation of their neighborhood datasets, Urban Mapping creates on purpose overlapping areas. However this fuzziness is appreciated by the engineers who have to integrate these types of data in their search engines. In addition, local search engines have been forcing users to search for location-based information by providing an area. Even if need types of queries are available, it is very difficult to make users learn to query based on monument rather than area (what is close to the Empire State Building?).
Posted: April 18th, 2007 | 1 Comment »
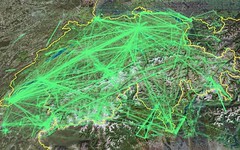
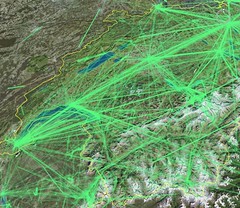
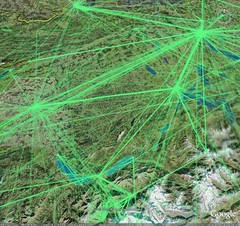
I started flooding the database for Tracing the Visitor’s Eye. For instance, I plotted the traces formed by 126853 geotagged photos taken in Switzerland. The transition between the main urban and natural attractions emerge:
Posted: April 11th, 2007 | No Comments »
Konomi, S., and Roussos, G. Ubiquitous computing in the real world: lessons learnt from large scale rfid deployments. Personal and Ubiquitous Computing (2006).
This article takes part of the train of thoughts on the inherent antagonisms of ubiquitous computing reality and the seamless calm computing vision advocated by some academic research. It does so by examining two fully operational Radio Frequency Identification-based systems: the Oyster card ticketing system used at the London Underground in the UK, and retail applications deployed at the Mitsukoshi departmental stores in Tokyo, Japan. Each case study is analyzed through the terms of technologies, user interactions, and their business and organizational context. As a result, the authors highlight that the real world has concerns that are rarely dealt with in research.
Ubiquitous computing in the real world has concerns that are rarely dealt with in research. Lengthy and costly preparation or upgrade of existing infrastructures; training of employees and users in the new ways of working; controlled introduction of new functionality; features and services to manage risk; unexpected behaviors due to the wider variety of possible real world situations; incremental approach to systems development so as to better identify successful aspects; regard for the economics of systems as a core requirement; and selection of open or closed systems, are all issues that are mostly outside the scope of current ubiquitous computing research, but seem to play a critical role in both case studies we consider here.
As a consequence, so far, the ubicomp of the present is made of isolated islands of functionality rather than a seamlessly connect whole. That brings the authors to define the challenges for ubicomp research around taking into consideration of the constraints of the real world but also in bringing a more user-oriented approach to research practices:
Therein lies the challenge for ubiquitous computing research: how not only to learn about the concerns of those developing systems in the real world but more importantly, how to translate principles, guidelines and models discovered in the context of research into useful tools for building ubiquitous computing systems in the real world. Bringing the two communities closer together and communicating lessons learnt in ubiquitous computing research so as to inform practical system design and development can have profound implications for the success or the failure of the ubiquitous computing vision.
Relation to my thesis: My research on spatial uncertainty revolves around the gap between practice and the state of the art in research. (That is in other words understanding both the concerns of the real world and the expectations of the users to build useful location aware application). This gap is well described by papers such as this one. I also ground my approach on the critique of researchers and technologies that absolve themselves for responsibilities for the present.
Posted: April 11th, 2007 | 1 Comment »
With now the barrier of 20 Million geotagged photos reached, Flickr is arguably the richest publicly accessible massive source of user-disclosed spatio-temporal data.
Relation to my thesis: I am observing emerging mobile/web-based LBS such as Plazes, Jaiku, Twitter, Dopplr to collect spatio-temporal data for my current exploratory work. Yet, so far Flickr proved to be the most promising dataset.
Posted: April 8th, 2007 | No Comments »
I have been perfecting the system to collect and analyze the data for my “Tracing the Visitor’s Eye” experiment. I expect to cover data of a 2+ years period from 11 different cities (plus one region, and a small country). Today, I played around with a small set of 3365 photos and 22110 tags taken by 236 anonymous flickr users (avg of 14.26 photos/photographer) in Barcelona from January 15 until March 1 2007. I focused on the basic temporal aspect of the data to see if the pulse of the city could be extracted. Here are the yearly (2.5 months), weekly and daily patterns revealing “urban heartbeats”:
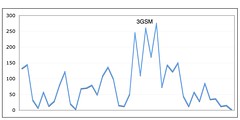
Yearly distribution over the period of January 15 and March 1. Bigger spikes appear between February 10 and February 15 for the 3GSM World Congress. Each weekend is a “urban heartbeat”. Would be interesting to compare how the attendees of 3GSM navigate the city as compared to other tourists.
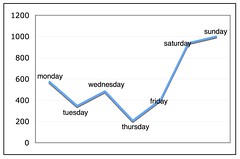
Weekly distribution. As expected, the weekend triggers more activity
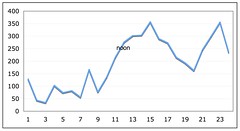
Daily distribution. Peaks in early afternoons and in the evenings. Similar to the graph of the GSM cell activity in the Milan metropolitan area
Of course, things will start to get interesting by crossing the temporal data with the accuracy, tags and spatial data to reveal the “where, what and why”. I am exploring techniques to categorize the photographers (tourists or citizen), create neighborhoods and areas of attractions of points of interests (probably by using the geonames dataset).
I am also observing very closely the experiments on the spatio-temporal data of Twitter (Mapping Twitter, twittervision, Twitter Maps – A Unique View of London) and Dopplr (Playing with sparklines on dopplr data). The very interesting aspect over these is that people not only disclose their history, but mainly the future intentions (Awareness of the future and some thoughts about classification). Studying how people disclose the location of their future intentions could help us understanding how to deliver in terms of location quality and timeliness such information.


