Posted: June 9th, 2009 | No Comments »
Colleague Andrea Vaccari has been touring a lot lately, presenting the MIT SENSEable City Lab’s latest works, including his own Obama One People project. He took time to answer interviews on ZDNet and more recently in ReadWriteWeb and the New York Times: The Emerging World of Real-Time Cellphone Data and NYC Waterfalls: How Real-Time Cellphone Data Can Impact Local Economies. In the latter, he goes into more detailed with the work on the NYC Waterfalls we led together last summer. Particularly, he discloses the research process we developed to qualify the impact of the Waterfalls on the attractiveness of the New York City waterfront (Lower Manhattan and West Brooklyn) as applied in our paper Quantifying urban attractiveness from the distribution and density of digital footprints. This process helps getting first answers on what ReadWriteWeb rightly wonders when asking “What Can Be Gained From This Data?”

Research process that starts with the collection of digital footprints, then the analysis over space and time of their characteristics that feed the definition and application of urban attractiveness indicators.
Relation to my thesis: The research process developed for the study of the Waterfalls was important to move beyond the pure descriptive work on Rome and Florence. After gaining a first understanding of the characteristics of the data, the current stage forces to prove that these digital footprints bring at least the same amount of knowledge than their “manual” data. In New York, our work complemented the official report on the Waterfalls economic impact.
Posted: June 8th, 2009 | No Comments »
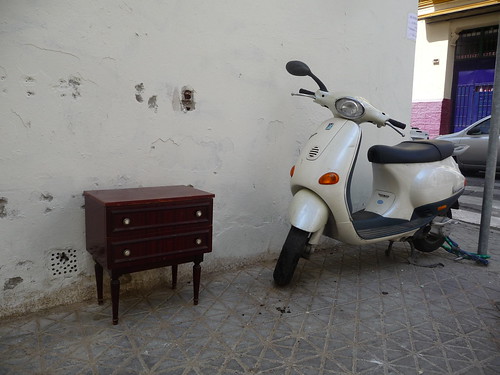
Last week, I participated to a Design Hub Barcelona (DHUB) session on “New Landscapes – Architecture Beyond Leisure. In my talk “people + technology + space“, I briefly presented the works, in relation to tourism, developed at UPF and MIT and featured at the Tourism. Spaces of fiction exhibition (i.e. Los Ojos del Mundo, Real-time Rome and WikiCity Rome). This exhibition focuses on tourism from planning, projection and design angles. The presence of an engineer+researcher was rather at odds with a parterre of architects and practitioners of the physical space. I am glad the curators Mario Ballesteros and Irene Hwang took the risk of exposing my different perspective coming from the study of hybrid cities. It got me to further grasp the degree of misunderstandings and differences of practices within the multiple actors that now touch the design of the public space (be it physical, hybrid or digital). The presentation I have seen had a very elaborated discourse on shaping the space for tourists and urban dwellers, but I expressed my doubts on the capacity of the current practitioners to engage in a design process that actually focus on people (for the sake of doing things right and to learn, see The end of temelessness). In contrast, architect Julien de Smedt described the work I presented as merely useless. A judgment I certainly understand coming from a practice that barely integrates the tourist as a human and discards the hybrid as part of the space.
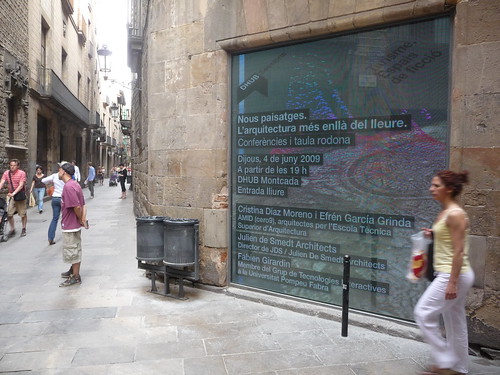
A mix of old bricks and fresh bits announcing the DHUB session.
Thanks to Carlos Ipser, Mario Ballesteros and Irene Hwang for the invitation!
Posted: June 3rd, 2009 | No Comments »
I returned from a weekend in Paris. with a rich doggie bag of take-aways and food for thoughts collected at the World Information City conference. The event focused on the major themes within the wide field of new urban geographies (i.e. mobilities, global flows, local dynamics, new forms of strategies of security, maps of emerging patterns of distributed action) with a generous brochette of theorists, scientists and activists.
John Urry opened the conference questioning the current period of human history made of unprecedentedly high and growing mobility in the light of dramatic climate change, the peaking of oil supplies. Indeed, beyond peak oil there is a massive potential for failure due to the dependence of society on mobility of humans, objects (mainly good such as water, food and oil) and the dependence of mobility on oil. Therefore, John examined future possible scenarios as to the character, scale and significance of mobility patterns with the imminent extinction of petroleum man through an Autogeddon. One scenario described the end of the fiesta of mobility with the return to “local sustainability” with a global shift towards lifestyles more intensely local and smaller in scale (a scenario going against some of the very reasons why cities exist that enable large scale operation and the need of anonymity). Another scenario, painted the possible emergence of “regional warlordism” with oil, gas and water wars leading to a relocalisation of mobility patterns (increasing separation between different regions). As Hobbesian war of each warlord dominated region/city against their neighbors. Plausible considering that the mobility of US army that consumes as much oil as a country like Sweden would have its mobility highly reduced. Finally, John Urry examined the scenario of the “digital panopticon” where digitized information is inserted within movement and increasingly in chips embedded within each person. digital development would be intrusive and threaten civil liberties as they transform the nature of the individual person. Linking information that lead to limit the freedom to walk, drive or move without connection being made with other information held about each person.
Each of theses scenario seem questionable and negotiable. They where not necessary meant to predict an assured evolution, but to engage the debate on the consequences of the development of “information cities” with mobility being dependant on oil and code. In conclusion, the 20st century based on mobility and oil has given a very bad hand to the 21st century. It provides a very complex environment where researchers need to transcent their own specialities, jump over and build bridges accress artificial disciplinary boundaries. And this is exactly what the World Information City conference was about. The major frictions e conference largely focused on the frictions of code/data with liberties/privacy; basically are we moving to an airport model of live? (reminding me to some extends of Airport code/spaces).
On that topic, Stephen Graham gave compeling examples of the remaking of urban spaces through new forms strategies of security. The emerging militarized control society encouraged by the dream of the perfect technology and the myth of the perfect power. They take multiple forms such as the security at the olympics and other large sport events (see paper Exemplifications of Surveillance through Sport Mega-Events), the Darpa Urban Challenge, or passage point urbanism that profile individues entry to some spaces. On the other hand, this evolution is not centralized and sometimes even contradictory, therefore refuting any conspiracy theory. Moreover the messiness and unpredictability of the world seriously challenge any technophilica dreams and their strategies of bordering (more on that in Sentient Cities Ambient Intelligence and the Politics of Urban Space and The Traditional, Messy Business of Getting Infrastructure into the Ground and more generally The Cybercities Reader.

Stephen Graham confronting technophiliac dreams with situated practices
Bruno Latour gave his spin to the notion of panipticon arguing arguing that with the kind of information (mmhmm… transformations) of the invisible city we should rather present it as an oligopticon that sees very little information very good. Based on his book the Paris: Invisible City, he gave several examples of oligopticons that are blind but plugged in, partially intelligent, temporarily competent and locally complete. For instance, Latour described a classic, very informatized situation room of the Parisian police, there is one person who pushes figurines on a map, because all the information persent in the room are not cognitively understandable. This policeman materialize the information through his practice that transform the information or as described in Paris: Invisible City
Can we say that the police officers in charge of traffic dominate all of Paris? Precisely not. Proof of that is in the strangest oligopticon of all, in these rooms containing so many of them. Close to a computer screen an official is sitting at a table looking at a map of Paris on a scale of 7,500 to 1, shifting around wooden figurines that he takes from a box as if he were playing Monopoly. Why? “Because SURF” he explains “gives an image that’s too precise! All the traffic problems in Paris have a ripple effect spreading over several kilometres. No computerized map enables us to vary the scale fast enough: either it’s too big or it’s too small; the frames are always too rigid. Here, with the figurines, I can see both the whole and the details, anticipate better and spread out my forces more effectively”.
Latour further attacked the current hype that the digital will bring us visibility. Indeed, with all their tools and visualization, Bloomberg could not detect the eve of the financial crisis. In fact, we are more aware of the limitation of the transformation and moderation of the information now with Google Maps than before with paper maps (further feeding the conclusion of my thesis on uncertainty and granularity of information!)

Bruno Latour on dominating traffic in Paris with figurines. Exemplifying the limitations of oligopticons.
With a contrasting techno-determinist tone, Carlo Ratti proposed solutions for sustainable mobilities such as CopenCycle, Track Trash to capture objects removal chain) and approaches to build a city as a real-time control system by feeding the complexity of urban dynamics back to people. However, these proposals mainly aim at optimizing the urban life, but it is still unclear what the parameters for optimization are and who defines them (preferably an transparent process). Moreover, there is still efforts to grasp the unentended consequences of the real-time. For instance there is no study of the feedback loop the reveal the implications a real-time control system (see for instance Cities as Networks in Geographical Euclidean Space).
Despite these critiques, Saskia Sassen encouraged the audience in thinking in terms of trajectories (chain of implications) rather than good or bad. Particularly when considering the role of city (and technologies) as disablers of powerlessness. For instance, in the case of illigal immigrants in California who were granted legal papers, their status became a voice in Los Angeles, not in the rural areas of the state. Of course, the same could have happened without technology, but technology become an unablers of extraordinary order of magnitude (see for instance in the financial domain). Can this same technology can be use of other domains such as environmentalism or urbanism that relies on the topologigraphic plan of the city is less and less effective with the current respresentation of the city.
I thought my talk People as sensors; people as actors (slides), given at the conference Data City workshop, echoed rather well with these notions of powerlessness and oligopticon. I described the ability to exploit open data with open “transformation” processes that aim at revealing some specific aspects (sentient city) of the city and improving its mechanisms (responsive city). I also explained the limitations of my oligopticons as tools that make the invisible visible reveal some elements of urban dynamics without explaining them. The interpretations of the analysis generate hypothesizes that are difficult to prove considering the messiness and complexity of urban dynamics. I suggested that only qualitative observation could help better understand the revealed. As suggested by John Urry, it could very well complement more traditional mobility studies (once again. further feeding the conclusion of my dissertation).
In that workshop, Christophe Cariou, founder of Everydatalab presented an innovative process of mixing quantitative data (anonymous logs of calls, handovers and sms) with user-generated content to map the Fête de la Musique night in Paris. In collaboration with Orange Labs, he exploited data visualized in Urban Mobs to extract the different scenes and the communities formed around them. The “abnormal” temporal signature of cellular network antennas help detecting the areas effected by the event as well as betweenness indicators (Girvan-Newman algorithm) in a graph formed by mobility traces (Christophe called them “steps”)
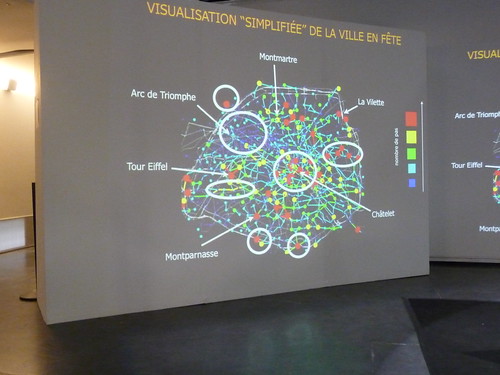
Map of the different scenes of activities at the Fête de la Musique in Paris
Besides presenting leading-edge investigation and innovative work on urban data analysis, I feel that we, researchers, still lack of discours that motivate our work (already expressed in Debates on Privacy-Preserving Statistics and Data Mining). This means going beyond the communication of the fascination for mathematical and statistical models and maps. For instance, Reading Steven Strogatz’s column on Math and the City, I feel that an important point of vulgarization should also communicate on the coarse grained laws of urban phenomena we need to discover and why use human networks can help us overcome the current mathematical understanding of complexity.
Moreover, I believe that we, researcher, need to listen more to the critiques and understand their foundations (for instance by reading La tyranie technologique or Eric Sadin’s surveillance globale). That should help evolve our practice and discourse; for instance we need to understand that it is not the anonymity of the data that raise concerns (by default they are expected to be so), but it is the ability to categorize society or perform social rating (as in marketing) that worries most. Similarly, in the worry of simplicity we, researchers, present the distribution of mobile phones as an close representation of society, inferring that at a 120% rate, everybody should wear at least a mobile phone (which is not the case). This simplification that depicts any ability for a paniptical view of society contradicts the oligoptical results of our works.
The critiques on the frictions of code/data with liberties/privacy we generate are therefore understandable. However, I believe the persons critiquing the analysis of digital footprints also suffer from lack of understanding of the motivations, processes and limitations of our research work. For instance, the disregards for people co-evolution with technologies lead to some sort of “negative techno-determitism” discourse in which technology now drives us to the wall, as if we suddenly had lost our proven abilities to hack and appropriate it. Similarly some critique discard the fact that “code” and data are now part of the life of the city, the makes the infrastructure and services work (our society is based on them, such as the domains of finance, planification). Moving beyond the state of denial of our dependency, the discussion should be about: what do we do with these data? with palettes of scenarios going from burying data as toxic waste to their use to develop the perfect power.
Between these two extremes, I have a lot of sympathy for Christophe Aguiton‘s proposition on the 3 layers of politics of living maps formed with data within a common good and part of a transparent process (algorithms) with an accountable set of rules and laws. Indeed, as the politics of robots and crawlers is here to stay (we depend on them), every single algorithm that touch the common good should be scrutanized (like we do for every element of society). In this society made of multiple oligopticons, the concern is not to make things visible (as argued for the panopticon), but rather to continue dealing the the opacity of information and politics.
An example of this process was taking place at WikiPlaza on the side of the conference. It featured the first set of Montre Verte prototypes made of a watch with two environmental sensors (ozone, noise) and a mobile phone that regularly communicates the collected data to an open platform which openly stores and visualizes them. My hat is off to the FING that proves that with the right people, a think tank can also become a do tank. Hopefully they will publicize their experiments of the Hexagon. The green watch will be featured soon in Marseille for Lift France.
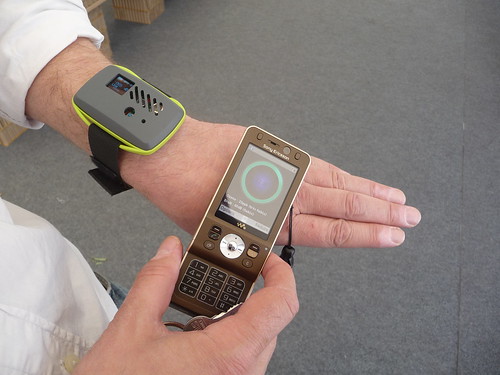
The first prototype of the Green Watch
Relation to my thesis: Conferences like World Information City serve the purpose to treat arguments that would be hard to voice in an academic conference of my domain. The discussions helped futher developped my understanding and arguments on the frictions of code/data with liberties/privacy; a theme it is important to master when working on people + technology + space.
Posted: May 21st, 2009 | No Comments »
I am co-writing the journal version of the paper Real-Time Geo-awareness – Sensor Data Integration for Environmental Monitoring in the City, a work led by Bernd Resch. My contribution considers the implications of the integration of environment monitoring system as element of urban life. I plan to articulate it as follows:
a) Tools to support practitioners
I reemphasize that this kind of work is first targeted to the information needs of local and regional governments. It can change the work of practitioners that was previously about predicting and accommodating and now it becomes more observing and improving. Indeed, this new ability to render all kinds of ‘machine readable’ environments not only provide new views on the city, but also provide urban and transportation engineers and planners with indicators to evaluate their interventions. For instance Dan Hill and Duncan Wilson foresee the ability to tune buildings and cities through pre and post occupancy evaluations. They speculate that the future of environmental information will be part of the fabric of buildings (see The New Well-Tempered Environment: Tuning Buildings and Cities). However, this integration opens all sorts of issues regarding sampling, density, standardization, quality control, power control, officiality of data, and update frequency (freshness).
b) An imperfect mirror to reality
A complete picture might be hard to achieve with incomplete environmental data patched together by data mining, filtering and visualization algorithms. In many ways we are limited to classic technical issues related to data resolution and heterogeneity. Even mobile sensors do not yet provide high-density sampling coverage over a wide area, limiting research to sense what is technically possible to sense with economical and social constraints. One set of solutions rely on the calibration of mathematical models with only a few sensors nodes and complementing data sources to create a set of spatial indicators. Another, approach aims at revealing instead of hiding the incompleteness of the data. Visualizing the uncertainty of spatial data is a recurrent theme in cartography and information visualization (see Approaches to Uncertainty Visualization). These uncertainty visualization techniques present data in such a manner that users are made aware of the degree of uncertainty in their data so as to make more informed analyses and decision. It is a strategy to promote the user appropriation of the information with an awareness of its limitations (see Notes on Seams, Seamfulness and Seamlessness).
c) Crowdsourcing
Another way to improve the environment data is to alter the current model whereby civic government would act as sole data-gatherer and decision-maker by empowering everyday citizen to monitor the environment with sensor-enabled mobile devices. Recently providers of geographic and urban data have also learned the value of people-centric sensing to improve their services and from the activities of their customers. For instance the body of knowledge on a city’s road conditions and real-time road traffic network information thrive on the crowdsourcing of geodata the owners of TomTom system and mobile phone operators customers generate. Similarly, the users of Google MyMaps have contributed, without their awareness, to the production the massive database necessary for the development of the location-based version of the application. This people-centric approach to gather data raise legitimate privacy concerns. These issues can be handled with a mix of policy definition, local processing, verification and privacy preserving data mining techniques (see Debates on Privacy-Preserving Statistics and Data Mining). These technical solutions necessitate a richer discussion beyond the academic domain on these observing technologies’ social implications.
d) Linking people to their environment
Similar crowdsourcing strategies have been considered for environmental monitoring with individuals acting as sensor nodes and coming together with other people in order to form sensor networks. Several research project explore a wide rande of novel physical sensors attached to mobile devices empowering everyday non-experts with sensing abilities. For instance, Participatory Urbanism investigates the empowerment of citizens to collect and share air quality data measured with sensor-enabled mobile devices. This ‘citizen science’ approach creates value information for researchers of data generated by people going on their daily life, often based on explicit and participatory sensing actions. By turning mobile phones (SensorPlanet), watches (Montre Verte) or bikes (MetroSense) into sensing devices, the researchers hope that public understandings of science and environmental issues will be improved and can have have access to larger and more detailed data sets. This access to environmental data of the city also become a tool to raise the citizen awareness of the state of the environment. Moreover, with the increasing rendering ability of data processing and visualization solutions, citizen can become the actual producers of these awareness tool (example: In the Air).
e) Linking people to their practices
These data gathering and rendering possibilities also implies that we are at the end of the ephemeral, in some ways we will be able to replay the city. In contrast we are also ahead of conflicts to reveal or hide unwanted evidences, when new data can be used to the detriment of some stakeholder and policy makers. Indeed, the capacity to collect and disseminate reconfigure sensor data influence political networks, focussing on environmental data as products or objects that can be used for future political action. Therefore, the openness, quality, confidence and trust in the data will also be subject of debate (e.g. bias to have people record their observations, who gets to report data and who not). The implication of citizens in measuring, sharing, and discussing our environment might increase agencies’ and decision makers’ understanding of a community’s claims, thereby potentially increasing public trust in the information provided by a real-time geo-awareness approach. In consequence this could connect people to the environment in which they live, and provide them with tools for reflection on the impacts of their practices (for example Scanning Objects in the Wild: Assessing an Object Triggered Information System). This objective of improving the environmental sustainability of a city calls for behavior modification can be induced by intervening in moments of local decision-making and by providing people with new rewards and new motivations for desirable behaviors (see Stanford Pesuasive Computing Lab). These kinds of strategies have been common, for instance, in health and fitness applications. However, when we think about persuasion in the real of environment sustainability, what we might want to persuade people of is the ways in which their interests are aligned with those of others (see Paul Dourish’s Points of Persuasion: Strategic Essentialism and Environmental Sustainability). Therefore, this process of alignment and mobilization, by which one can start to find one’s own interests as being congruent with those of others will be critical in the success of these strategies based on real-time geo-awareness.
Relation to my thesis: Applying the kind of transdisciplinary work I have been discussing since the Real-Time Cities Round Table I setup last year. Here trying to provide an HCI perspective to the cutting edge work lead by research in GIS (Research Studio iSPACE) and Environmental Fluid Dynamics (Rex Britter) in the domain of sensor data integration for urban environmental monitoring.
Posted: May 21st, 2009 | No Comments »
The MIT SENSEable City Lab has unveiled a new project that visualized and analyzed the mobile phone call activity that characterize the crowd Barack Obama’s Inauguration Day. Led by Andrea Vaccari, this work aims at answering the questions: Who was in Washington, D.C. for President Obama’s Inauguration Day? When did they arrive, where did they go, and how long did they stay? The data analyzed consists of hourly counts of mobile phone calls served in Washington, D.C. and includes the origin of the phones involved in the calls. To ensure the complete privacy of the mobile customers.
Besides the dazzling visualizations of Washington DC and the World developed by Mauro Martino, the early findings of the data analysis confirm and quantify the popular impressions. For instance, examining the relative increase in call activity by state reveals some unexpected results. In absolute terms, the most represented states were, unsurprisingly, the most populous: California, Florida, New York, and Texas. In relative terms, the states with the strongest increase were the southern states of Alabama, Georgia, Kentucky and Tennessee, with calls up to twelve times the normal levels. These are states that played a prominent role in the Civil Rights movement and notably are also so-called red states whose voting population went for the Republican candidate, John McCain. Other states with a ten-fold increase in call activity were Illinois, Barack Obama’s home state, and Michigan, Ohio and Indiana, swing states which went blue, voting for President Obama. Most interestingly, comparing these results with U.S. demographic statistics shows that the percentage of African Americans in each U.S. state is a predominant factor determining increase in call activity and therefore participation in the event, which instead was not necessarily influenced by the state’s proximity to Washington, D.C. or its political leaning.

The City joins the mobile call data with a map of Washington D.C. to produce a stirring visualization. The areas around the Mall and Pennsylvania Avenue, where most inaugural activities took place, are highlighted on the map with 3-D building models colored in yellow. In the center of the screen, the map of Washington, D.C. is overlaid with a 3-D color-coded animated surface of square tiles (1 tile represents an area of 150 x 150 meters). Each tile rises and turns red as call activity increases and likewise drops and turns yellow as activity decreases. On the left, a bar chart breaks down the call activity by showing the normalized contributions of calls from the 50 states and 138 foreign countries grouped by continent. The timeline at the bottom illustrates the overall trend of call activity in the city during the week of the Presidential Inauguration.
Similarly, the analyses on call activity in the days before and after January 20 also reveal that the Inauguration was a multi-day event as mobile phone traffic increased markedly throughout the week. The hotspots of activity were clustered in the Northwest neighborhoods of the city, around Downtown, Adams Morgan and U Street.
Relation to my thesis: While these results confirm the popular impressions, they are yet another example on the potential to quantify and compare the presence of people in different areas of the city and to unveil their dynamic movements through time (where people come from compared to a regular day, the Inauguration was a multi-day event). A next step in this kind of research process would be to better link the findings of the data analysis with the visualizations.
Posted: May 19th, 2009 | No Comments »
My paper Quantifying urban attractiveness from the distribution and density of digital footprints (pre-editing PDF copy) co-authored with Andrea Vaccari, Alexandre Gerber, Assaf Biderman and Carlo Ratti has been accepted for publication in the International Journal of Spatial Data Infrastructures Research, pending minor revisions. I would be extremely curious to hear the feedback of practitioners and other researchers on that work. The abstract goes as follows:
Abstract. In the past, sensors networks in cities have been limited to fixed sensors, embedded in particular locations, under centralised control. Today, new applications can leverage wireless devices and use them as sensors to develop aggregated information. In this paper, we show that the emerging patterns unveiled through the analysis of large sets of aggregated digital footprints can provide novel insights into how people experience the city and into some of the drives behind these emerging patterns. This information has uses for local authorities, researchers, as well as service providers such as mobile network operators. To explore this capacity for quantifying urban attractiveness, we performed a case study using the distribution and density of digital footprints in the area of the New York City Waterfalls, a public art project of four man-made waterfalls rising from the New York Harbor. Methods to study the impact of an event of this nature are traditionally based on the collection of static information such as surveys and ticket-based people counts, which allow to generate estimates about visitors’ presence in specific areas over time. In contrast, our contribution makes use of the dynamic data that visitors generate, such as the amount and distribution of aggregate phone calls and photos taken in different areas of interest and over time. Our analysis provides novel ways to quantify the impact of the public art exhibit on the distribution of visitors and the attractiveness of points of interest in the proximity of the event.
The paper received good grades particularly for its originality and relevance to spatial data infrastructure research. The reviewers suggest several areas of improvement:
a) Comparative evaluation with tradition surveys
It seems necessary to provide a more reflective discussion of what exactly is the added value of our approach compared to traditional surveys(comparative evaluation with strength and weaknesses). Here I could take some of the argumentation developed by Carlo Ratti in his critique of Space Syntax: Space syntax: some inconsistencies. Then of course, I can compare with the official economic impact study performed on the Waterfalls. Anthony Townsend offers some thoughts on the mix of survey methods “the interplay between top-down systems of command and control versus bottom-up systems for collective action“.
Plus, I have to make an extra effort to describe that, following the literature, we conceptualized spatial attractiveness as a property of a well-defined place that has variable size. One reviewer seemed to have understood that our concept of urban attractiveness was based on a continuous field. Also, I have to improve with more details the data collection process (with reference to prior papers that go more into details with that aspect of the work).
b) Expended literature review
Indicators and centrality
There is a need of an expanded review of the current literature 2 on indicators, centrality, etc. to help understand the added value of our approach. This point is related to a). I could the examples of the indicators developed at Barcelona Ecologia, particularly in the domain of public space and mobility developed by good friend Yuji Yoshimura (blog). These practical example can be augmented by some of my consideration on Urban Attractiveness particularly, the mention to centrality, density and attractiveness:
In other words, city centers have been the focal point of citizen’s urban life. Therefore, the lack of monitoring of their attractiveness could be regarded as an immediate threat to the liveliness of their economy. Measures from urban data (e.g. land use, census, traffic data) and statistics (e.g. NYC’s Sustainable Streets Index) traditionally feed the suspicions and are less traditionally augmented with the systematic collection of people’s experience, as suggested by Marek Kozlowski’s PhD thesis Urban Design: Shaping Attractiveness of the Urban Environment with the End-Users that aims at obtaining subjective views of end-users and integrating this information into the urban design process.
There might be more relevant references in the Urbanism on Track book.
Volunteer generated information
Several important contributions on volunteer generated information are missing from the literature review. In particular of the recent special issue of GeoJournal such as Discovering points of interest from users’ map annotations and Volunteered geographic information: key questions, concepts and methods to guide emerging research and practice. There is also Matt Zook’s New Digital Geographies: Information, Communication, and Place (already mentioned in the conclusion of my thesis) and more recently How Does Software Make Space? Exploring Some Geographical Dimensions of Pervasive Computing and Software Studies by Martin Dodge, Rob Kitchin and Matt Zook. In the discussion on the quality of digital footprints there is a relevant paper on Addressing vagueness in Volunteered Geographic Information, still under review in the International Journal of Spatial Data Infrastructures Research, Special Issue GSDI-11.
It will be important to refer to the more practical works that have emerged after the submission of the paper such as Mapping the cultural buzz and Mapping the World’s Photos
c) Density estimation and Spatial interaction modeling
It would be good to link this work to the literature of density estimation (see Bernard Silverman’s Density Estimation for Statistics and Data Analysis) nd of the estimation of attractiveness in the context of spatial interaction modeling (Fotheringham and O’Kelly’s Spatial Interaction Models: Formulations and Applications). A reviewer mentions this would help to place the work on a sounder basis, and to address the kinds of “why” questions that would make the paper more than descriptive.
d) More work on figures
More attention could be paid to the figures, particularly Figure 3 could display isolines, location points of photos could appead on Figure 4 and there could be an effort to map more effectively the urban indicators such as attractiveness and PlaceRank
Relation to my thesis: This paper is part of the research on the Next Generation Digital Earth, promoted by the Vespucci Initiative. I have a lot of sympathy for their open research model of the International Journal of Spatial Data Infrastructures Research based on creative commons license. This greatly facilitate the timely exchange of ideas and feedback. The publication of this paper is important to close my thesis. The research on the NYC Waterfalls generated also generated a conference paper focused on estimating the presence of visitors of the exhibit. It will be presented at the 11th International Conference on Computers in Urban Planning and Urban Management (CUPUM)
Related to: Reviews From Latest Submitted Papers
Posted: May 19th, 2009 | No Comments »
A couple of initiative to discuss the management and mining of personal electronic information: The MIT SENSEable City Lab starts the Engaging Data Initiative with the First International Forum on the Application and Management of Personal Electronic Information (see CFP). The goal of this forum is to explore the novel applications for electronic data and address the risks, concerns, and consumer opinions associated with the use of this data. At the other side of the Pond, an afternoon will be dedicated to the obligations of French companies in handling their personal electronic information: Anonymisation des données : Cachez ces informations que nous ne devrions voir !.
The paper Mobiscopes for Human Spaces set the debate on these privacy-preserving data mining issues. They present a “mobiscope” has a federation of distributed mobile sensors into a taskable sensing system that achieves high-density sampling coverage over a wide area through mobility. Vehicular and handheld mobiscopes complement static sensing systems by addressing the fundamental limitations created by fixed sensors. Classic technical issues relate to data resolution and heterogeneity. The authors propose to handle privacy issues with policy definition, local processing (such as for my travel survey study), verification and privacy preserving data mining. Besides these technical solutions they acknlowledge the necessity to have a richer discussion of these observing technologies’ social implications
- explicitly considering broader policy precedents in information privacy as they apply to mobiscopes,
- extending popular education on information technology’s new observation capabilities,
- facilitating individuals’ participation in sensing their own lives, and
- helping users understand and audit their own data uploads.
However, the debate avoids the motivations behind research works behind mobiscopes. For instance, in what scenarios do we need high spatial density to accurately sample the field of spatially varying phenomena? When do the desirability of instantaneity and speed contributing to the health of society? Who are the “users” (a term often abused in the literature on personal electronic information) and are these “users” aware of their role of “user? For instance, reading You’re Leaving a Digital Trail. What About Privacy? makes me wonder if the debate on privacy can evolve if researchers do not make a serious effort in describing value-added scenarios without a techno-deterministic rhetoric.
Reference:
Abdelzaher, T., Anokwa, Y., Boda, P., Burke, J., Estrin, D., Guibas, L., Kansal, A., Madden, S., and Reich, J. (2007). Mobiscopes for human spaces. IEEE Pervasive Computing, 6(2):20–29
Eric Sadin, Surveillance globale (généralisation du principe de quantification invidualisée des personnes qui se met en place depuis l’universialtion de l’interconnexion)
Relation to my thesis: Elements to form an argumentation on privacy issues related to my research domain
Posted: May 19th, 2009 | No Comments »
Last week I participated to the workshop “La Ciudad Híbrida” organized in Sevilla by José Luis de Vicente. The first 2 days, we used different theoretical lenses and practical references to explore the many different aspects of the hybrid city. Juan Freire engaged us with proposals for a participatory urbanism with the design of open processes and bottom-up solutions (see De la ciudad híbrida al urbanismo P2P: democracia 2.0, gestión local participativa y crowdsourcing). José Luis de Vicente stepped back and led us through the history influenced by urban theorist, architects and artist that have paved the way to the hybrid city of the 21st century, the dynamic city (see Una historia de la ciudad de software: arquitecturas dinamicas y sistemas digitales urbanos). An argumentation completed by Juan Martín Prada who covered the rich field of location media with a philosophic spin (co-existance men-thinks, men-animals, men-deads, the urbanization of the real-time city (networked city) vs. desurbanization of the real-space; the “Here” being replaced by the permanant “Now”.
Before Juan Martin, I played the role of “data cowboy” with a 90min talk (in Spanish) that looked at the contemporary hybrid city through the lenses of my research work augmented by some offline observations. In this intervention entitled “People as sensors; people as actors” (slides with annotations, video), I look at the integration of ubiquitous technologies (and soft infrastructures) and how they afford us new flexibility in conducting our daily activities with simultaneously providing the means to study our activities in time and space.

The other part of the workshop was dedicated to more hands-on activities in which groups had to define, sketch and prototype a citizen-led system or process that take advantage of open/public urban data. With a majority young architects, the focus was first based on “infrastructure”, “mobility”, “space”, but then rapidly also evolved around social issues and even political touching the Critical Cartography approach and critique. There was a lot to learn from the languages employed by participants with different practices (architects, social scientist, biologist, artist).
Finally, Sevilla provided an excellent context to ponder the hybrid city of the present. In addition to its rich history of mixed cultures, architectures and art, engineering work and south-european clichés, the city offers the vestiges of the techno-utopian Expo ’92. The crumbling infrastructure at the Cartuja Island is source of fascinating sightseeing with an Ariane V on the loose and a monorail in advanced decomposition among other things. The theme for the Expo was “The Age of Discovery”. mmhmm.
Sevilla, a true hybrid city….
…with its real urban furnitures
Thanks José Luis for the invitation!
Posted: May 5th, 2009 | No Comments »
An Amsterdam in Real Time or CopenCycle with a qualitative spin, Martha Skinner proposed BiCi_N Urban CT-SCAN a project based on the GPS tracks and video footage collected by Bicing riders.


Relation to my thesis: Bikes used a collecting and drawing tool to view the city from within and from above. This kind of urban cat-scan is similar to the replay tools developped for pervasive game research to analyze players collaboration and interactions from a mix of both quantitative and qualitative views.
Posted: April 29th, 2009 | No Comments »
A workshop on Hybrid Design Practices will take place at the upcoming Ubicomp conference. The focus is close to the interplay of methods I applied in my thesis, mixing design science research methods with qualitative and quantitative inquiries:
The focus of this workshop is on hybrid design practices, approaches that draw on techniques from various fields to create novel methods of inquiry. The aims of this workshop are, first, to bring together a multi-disciplinary group of practitioners and researchers to learn from one another’s expertise in choosing and evaluating methods of design practice, and, second, to discuss implications of the underlying methodologies and epistemologies upon which these techniques are built.
The goals of this workshop, then, are twofold; first, to open up a space for reflection on current approaches towards interdisciplinary research and design in Ubicomp, and second, to develop a new vocabulary, both practically and theoretically, for “making” interdisciplinary Ubicomp research, thus, marking the study of hybrid design practice as an area of community-wide inquiry.
Relation to my thesis: My thesis has an unsual aspect characterized by some sort of hybrid design practices that led to the production of “factual” knowledge (such as the urban flows shown in some of the papers) and “design” knowledge (such as the strategies for improving interaction). My thesis also contains methodological novelties when approaching human interactions with ubiquitous geoinformation, such as models and concepts related to implicit and explicit interactions. I believe this diversity that provides complementary sources of evidence, strengthen the support to the results presented
in the thesis (i.e. strengthening the approach through the diversity). This is rather non-standard, but it is hopefully a recognized attempt for for “making” interdisciplinary Ubicomp research.