Posted: November 28th, 2008 | 1 Comment »
This year’s Visualizar workshop “Database City” ended a couple of weeks ago. Curator José Luis de Vicente designed this 2-weeks workshop in 4 steps. I started with a 2-days seminar to theoretically ground the theme, then 5 days to frame the goals of the 7 selected projects and perform some exploration with the tools and datasets. The seconds week was dedicated to the development of the visualizations and finally wrap everything into a self-contained web site and video. A blog (“diario de campo”) kept track of the daily outcomes of the process.
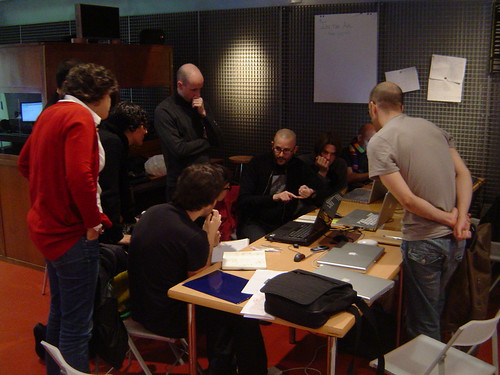
Lecturer Adam Greenfield on the battlefield (and why he was there)
As a lecturer and tutor of the first week, I helped participants in moving beyond the pioneers works that aimed at solely mapping the emerging patterns of these new urban data. I encouraged them to explore analysis techniques (e.g. data-mining, statistics, user interaction) as the necessary next step to understand and assess the real meaning and potentials of urban data for the digital cities.
Most of the groups delivered very high profile outcomes. They can be seen at Medialab-Prado in Madrid until January 11. Great works include:
In the Air, led by Nerea Calvillo
In the Air is a visualization project which aims to make visible the microscopic and invisible agents of Madrid´s air (gases, particles, pollen, diseases, etc), to see how they perform, react and interact with the rest of the city.

The visualization tool is a web-based dynamic model which builds up the space the components generate, where through data crossing behavior patterns emerge. The results of these data feed a physical prototype of what we have called a “diffuse façade”, a massive indicator of the air´s components through a changing cloud, blurring architecture with the atmosphere it has invaded and mediating the activity of the participants it envelops. (Wiki of the project – Video of the making)
Murmur Madrid, led by the group Writing Academic English
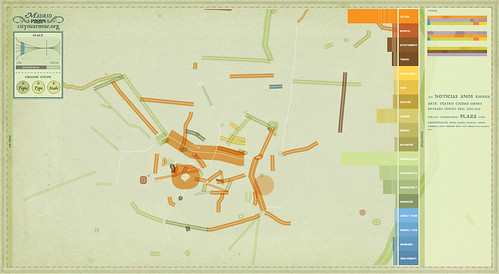
Visualising the media attention to the urban space, street by streets. Official news, blog and personal website, thematic media will be monitored to generated maps that highlight the pattern of perceptions on the urban space. This mapping will lead to the creation of an atlas that will monitor in time the changing perception of the city areas. The atlas will produce different dynamic visualizations based on themes, sources and time. (their stunning poster on How does a Murmur come to life?)
Much Ado About Nothing, led by Iván Huelves Illas

This project proposes to create an interactive tool (mixing visualization and auralization) that makes it possible to consult noise level at specific locations in Madrd.
BCNoids, led by Marina Rocarols and Enrique Soriano

A group of students in architecture that used a Boids framework to develop an interactive visualization of the online data generated by the bike-sharing system Bicing (Video of their experiments). The long term objective is to design an applet for the improvement of the bicing website, including a prediction of the number of available bikes in each station.
Relation to my thesis: A unique hands-on workshop where I probably learned as much as the participants. There is still a high fascination in mapping urban data and our digital footprints. To try to move beyond the pure innovative visualization, I challenged very early the groups in asking themselves “so what?”, in other works: “why should people care?”, “who do I communicate this to and for what purpose?”, “what are the scenarios of interactions?”, “what is their context?” and question how these kinds of works and the message they carry integrate the digital city of the future (e.g. cultural, readability issues).
Many thanks for José Luis de Vicente for the invitation. It was great fun to cross path with the Bestiario‘s Ortiz cousing Andrès and Santiago, Juan Freire (in his talk… he puts his marin biologist hat and draws comparisons between the ocean and the city and their digital skins… with references to Stephen Graham, now my chapeau is off), Greg J. Smith, Futurelab’s Dietmar Offenhuber and good companion Adam Greenfield and and the energetic media lab prado squad,
Apparently, Dan Hill is running a similar 2-weeks sting at the antipode: The street as platform, under construction.
Posted: November 11th, 2008 | 1 Comment »
Last week at Visualizar’08, I presented the long version of my talk From Sentient to Responsive Cities (slides with notes, video). This talk compiles many of the thoughts and works I produced over these past couple of years. It is divided into three parts:
Microscopes and telescopes
I discuss the dynamic data we generate when actively or passively interacting with new urban actors such as wireless networks or RFID systems. The mapping of these data reveal many invisible dynamics of the city and this often in real-time (with Bicing, Velib or Flickr as data sources). Research in that domain have produced beautiful microscopes and telescopes to visualize urban dynamics. Besides their utility in stretching the imagination of stakeholders in the city, they do not allow to understand “what we see”.
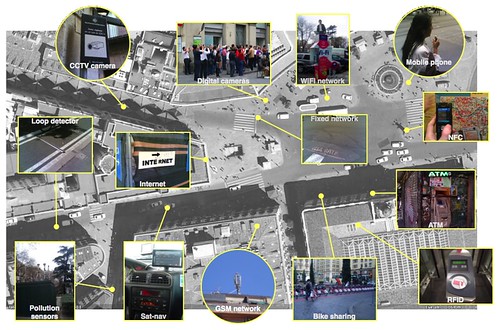
Mapping new urban actors
Evidence and loops
New techniques are being developed to transform the massive amount of dynamic urban data into evidences and information that can be acted upon; moving from purely Sentient to Responsive cities. From the dynamic census of a city from its cellular network activity to the definition of indicators to measure the evolution of the attractiveness of places, there are potential to create a new type of urbanism based evidences generated with the analysis of digital footprints actors of a place leave behind them. These evidences can transform the evaluation of urban design and digital urban services with post-occupency evaluations often overlooked in the practice of architecture and urban design. Similarly the communication of the information generated back to actors of the urban space could create a feedback loop in which the analysis of the data impact the activity of people that create new data and so on.
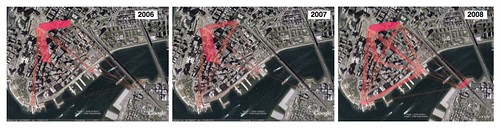
The evolution of the flows of photographers in Lower Manhattan in Summers of 2006, 2007 and 2008.
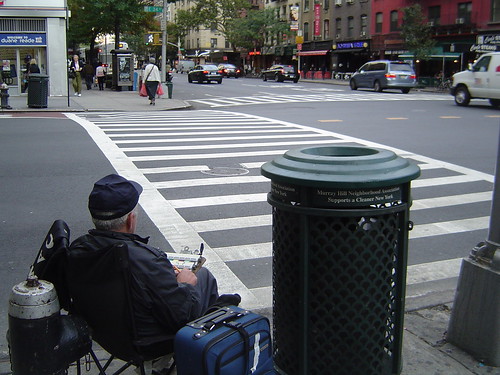
Taxi drivers
But how to integrate this type of mechanism by taking into consideration the complex socio-technical assemblage of cities? A set of answers can come from the observation of current deployment of ubiquitous technologies in the city. Therefore, I studied of the integration of satellite navigation system into the practice of taxi drivers describes the co-evolution people have with technologies: how they adapt to it and how they adapt it to their practice. The observations reveal the necessity to have a large knowledge of the city judge the quality of the information provided by sat-nav system. Novice taxi drivers were often not trusting system and access the paper street guide and maps to support their navigation and wayfinding; the satnav system becoming a tool among a large eco-system of artifacts.
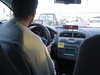
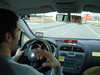
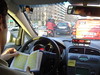
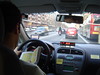
A taxi driver mixing the use of a satnav and the official street guide of Barcelona.
Relation to my thesis: An attempt to find a coherence in my multiple works. I might have found a good line of thoughts in describing the potentials to transform urban data into evidences and information that can be acted upon. (Paco Gonzalez produced a summary in Spanish)
Posted: November 4th, 2008 | 1 Comment »
This week, I am Visualizar08 Database City Workshop at Media Lab Prado in Madrid. The program of this 2-weeks workshop mixes theoretical seminars with hands-on development of 9 selected projects of data visualization applied to the urban context. Today I gave the long version of my “From sentient to responsive cities” talk in which I laid out many aspects of my research including the mix of quantitative urban data analysis and qualitative observations (taxi drivers). More on that later.
Other lecturers include Juan Freire (Visualizing Urban Spaces’ Digital Skin. How? Why?), Andrés Ortiz from Bestiario (What’s that good for?) and Adam Greenfield with his opus The Long Here, the Big Now, and other tales of the networked city.
Relation to my thesis: A unique event that covers my thoughts and instantiation discussed here. I used my talk as an experiment to find a coherent line of thought for the outline of my dissertation.
Posted: October 31st, 2008 | 1 Comment »
A few thoughts on the state of research in urban informatics sketched from here and there…
With a few workshops (e.g. Digital Cities, UrbanSense, Real-time Cities), loosly-related conferences (e.g. CUPUM, ), books (e.g. Handbook of Research on Urban Informatics, journal special issues (e.g. IEEE Computer, IEEE Pervasive Computing), dispersed research groups (Darthmouth College Sensor Networks Group, MIT SENSEable City Lab and Smart Cities, CMU Living Environments Lab, UCL’s VR Centre for the Built Environment and CASA) extensive blog post (e.g. Julian Bleecker, Karen Martin, Nicolas Nova; Anne Galloway’s blog a research tool) and courses taught at a graduate level (MIT’s ambient informatics, NYU’s urban informatics), urban informatics is not a research field but rather a set of intersecting practices and broader disciplines swirling about those practices. It is still ill-defined and at its infency with a lack of paradigm. I have always presented this intersection with three main tendencies: understanding urban dynamics, understanding the integration of ubiquitous technologies in urban life and designing technologies for people in the city. Others defined it as “the integration of computing, sensing, and actuation technologies in everyday urban settings and lifestyles“ (Kindberg et al., 2007) or “the collection, classification, storage, retrieval, and dissemination of recorded knowledge of, relating to, characteristic of, or constituting a city” (Foth, 2008). To my view, it involves the research on 4 layers:
1. Urban data gathering (What can be sensed?)
2. Urban data analysis (What can we do with what is quantitativly sensed and qualitativly observed?)
3. Information visualization (What can we communicate?)
4. Designing technologies and services for the city (How to design to improve?)
A urban informatics blue collar counting traffic of trucks, cars and bicycle at a random crossroad in a random gridiron plan city.
A majority of research done one or many of these layers has been driven by an utilitarist perspective that models a city as a system and that aims at improving its efficiency. The background of work in that domain partially explain the lack of consideration of human and social realities. Not to blame the, but computer and information scientists, engineers, architects, and urban designers are no necessearly trained in assessing the implications of their interventions. Only recently the technodeterministic approach has been challenged (e.g. in Urban Computing and its Discontents) through the influence of designers (e.g. Adam Greenfield and Dan Hill), social scientists (Anne Galloway, Bruno Latour), historian (e.g. Antoine Picon) and geographers (e.g. Phil Hubbard, Mike Crang and Stephen Graham). Their influence generates the emergence of a new language that computer scientists integrate in their work forging transdisciplinarity skills (highlighted my report of the Real-time City Round Table). In consequence, it is noticeable that now social considerations go beyond privacy issues and touch the domains of the impact of the research (e.g. positive change of practices) and the design for its appropriation (how to integrated into citizen daily life or a city administrative decision process). Nevertheless, research in urban informatics is still at an exploring phase that builds “telescopes” and “microscopes” that paint the city. It will need converging teams and languages to build a field and a science to study “what we see” and help generate theories and a body of knowledge.
Relation to my thesis: forming some thoughts on the context of my research that I can extend in my dissertation.
Posted: October 25th, 2008 | 6 Comments »
The methods and tools I have developed at the MIT SENSEable City Lab to explore the significance of the new types of user-related spatiotemporal data have been published in the current issue of the IEEE Pervasive Magazine. In Digital Footprinting: Uncovering Tourists with User-Generated Content I describe how our approach helps uncover the presence and movements of tourists from cell phone network data and the georeferenced photos they generate.
Girardin, F., Calabrese, F., Dal Fiore, F. , Ratti, C., and Blat, J. (2008). Digital footprinting: Uncovering tourists with user-generated content. IEEE Pervasive Computing, 7(4):36–43.
Relation to my thesis: A follow-up work of the case study in Florence. In this paper I explain how different types of digital footprints visitors leave behind when visiting Rome, capture their presence at different places and moments. While, the analysis of georeference photos help define sightseeing areas, mapping the aggregated cellular network activity originated from foreign mobile phones reveal places of travel (train station) and lodging
(hotel areas).
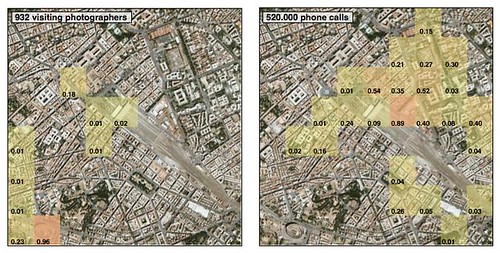
Geovisualizations of the presence of (a) 932 tourist photographers and (b) 520,000 phone calls from foreign mobile phones in the Coliseum and Piazza della Repubblica area from September to November 2006. Both types of data cover the train station area in the proximity of the Piazza della Republica. The values in each cell are normalized.
Posted: October 22nd, 2008 | No Comments »
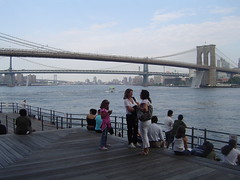
Today’s New York City mayor Michael Bloomberg announcement of the New York City Waterfalls economic impact marked the end of an intensive project I led over the summer at the MIT SENSEable City Lab. With innovative analysis of digital footprints to describe the evolution of the attractiveness of the Lower Manhattan and Brooklyn waterfront, we contributed to augment a study that used more traditional means (i.e. manual counts and surveys) to quantify who was attracted by the Waterfalls public art exhibit and how much money they spent. Our approach relied on several “indicators of urban attractiveness” inspired from financial indicators and network theory. For instance, in collaboration with Andrea Vacarri, we compared the attractiveness of the main points of interests in New York from the relative strength based on the density of digital footprints; or the evolution of the centrality of the waterfront among the network of points of interest generated by the flows of visitors in the Lower Manhattan area. The mapping of this new type of digital footprint analysis shows the impact of an event to open-up and drive people to new parts of a city over time.
Evolution of the flows of photographers in proximity to the exhibit from the analysis of photos generated between June and October in 2006 and 2007 and June and August 15 in 2008
Besides generating these preliminary research outcomes, there was a lot to learn from running digital footprinting techniques in parallel from traditional studies. The unconventional aspect of this type project leads a city to unbeaten territories where administrative procedure must be created. The data sets and methods must constantly be clearly explained. Liability and privacy issues are the obvious subject that necessitate constant clear descriptions of the data sets and methods used. Of course, in exploratory research that aims at developing the latter, this is not always evident, particularly with tight time constraints. In addition, the applied aspect of this research requests skills to communicate the value of the analysis for the present and the future. A situation I was already confronted in Florence when presenting research results to local authorities and journalists.
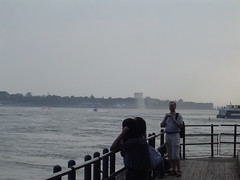
People generating digital footprints and digital shadows this summer in proximity to the NYC Waterfalls
Relation to my thesis: Research outcomes of this work will fit to the core of my dissertation. The overall experience of leading a digital footprint study to quantify the evolution of the attractiveness of an urban space fit with my interest in developing mixed methods to perform post-occupancy evaluations in the future. Unfortunately, in this project I could only rely only on very little qualitative observations.
Posted: October 22nd, 2008 | No Comments »
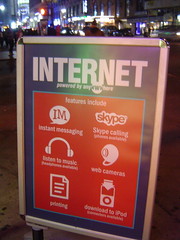
The evolution of the Internet “features” offered in public spaces from the AOL and infrared years (photo courtesy of Julian Bleecker)
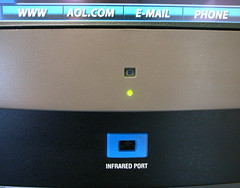
to the contemporary times of Skype and iPod connectivity overshadowing the www.
Posted: October 6th, 2008 | No Comments »
After a summer of dense project coordination and urban data analysis, time is slowly coming to frame the content of my PhD thesis dissertation. I plan to submit it in March 2009 with a timeline composed of 3 months to complete the current “deep dig” analysis of digital breadcrums followed by another 3 months early next year of compiling and writing the dissertation. Discussions with my PhD advisor led to the agreement that the dissertation should cover the extensive work I have been leading in the aspects of implicit and explicit human interaction with pervasive geoinformation. In practice it implies framing my analysis of pervasive user-generated content as a core element alimented with more qualitative studies on the perception and generation of location information (with an emphasis on location quality and uncertainty) and the co-evolution of humans with location information. It creates the challenge to keep a flow of thoughts between the different studies, but it allows me to build on the approach to mix quantitative digital footprints analysis enhanced with descriptions from qualitative observations. A mixed approach I would like to document and ponder for my post-academic life.
The next step is to staple my paper together and write a chapter that summarizes the contribution for each work. Then from each contribution see what kind of linking is necessary. My work addresses a few questions created by the increasing amount of implicit and explicit interaction people have with digital infrastructures in the (urban) physical space:
1. How do we co-evolve with the pervasive availability of geoinformation?
2. How do we manage (interpret and generate) the fluctuating quality of geoinformation?
3. How to take advantage of these novel massive amount of pervasive user-generated geodata?
My thesis addresses these question first by describing how the location information provided by pervasive appliances impacts our work practices, a theme I cover in The co-evolution of taxi drivers and their in-car navigation systems (and other more complete paper still in progress). The very different appropriation of the systems raises the issue of the user interpretation of location quality that I categorize in the experiments on CatchbBob! summarized in Getting real with ubiquitous computing: the impact of discrepancies on collaboration and Issues from Deploying a Pervasive Game on Multiple Sites. A fluctuating location quality is part of humans practice of generating and sharing geoinformation as highlighted in Place this Photo on a Map: A Study of Explicit Disclosure of Location Information and Assessing pervasive user-generated content to describe tourist dynamics. I still need to finish my study and publish on the practices of geoannotating and georeferencing information. Despite the imperfections of sensors-based and user-generated geoinformation constantly generated implicitly or explicitly, their aggregation and analysis (following privacy regulation and ethical guidelines) provide novel perspectives on understanding urban dynamics and particularly tourism. I covered the opportunities from the development of softwares to the application of data analysis techniques that I entitled “digital footprinting”. The contributions include the collection, visualization and analysis of digital footprints that reveal tourist dynamics in Leveraging explicitly disclosed location information to understand tourist dynamic: a case study (Journal of Location Based Services) and the analysis of digital shadows and their correlation with digital footprints in Digital footprinting: uncovering the presence and movements of tourists from user-generated content that reveals the complementary perspectives of each data set. Other data analysis techniques on digital shadows allow to Quantifying the presence of visitors from the mobile phone network activity they generate (International Forum on Tourist Statistics, in print) and develop indicators on the urban space that perform Measures of urban attractiveness based on the analysis of digital footprints (in progress). While these approach focus on aggregated data and crowds, specific mobile software developments allow to perform mobility panel studies on a world-wide scale with system that perform World-wide air travel detection (in progress).
Relation to my thesis: Setting a deadline to finish in 3.5 years and framing the work done so far under one umbrella. The challenge will be to link the multiple contributions under a common umbrella. Equality important will be to keep a scientifically honest piece of work that is accessible to people on the edges of academia. For instance, I was advised not to hesitate in referencing to my blog and acknowledge it is a research tool (inspired by Anne Galloway’s PhD disseration).
Posted: September 30th, 2008 | No Comments »
Last week at Picnic took place a session on the The Visible City that featured projects that map cellphone network activity mobility as proxy of different urban dynamics in a city. Euro Beinat Director Sensible Future Foundation revealed the Current City initiative was with an artistic animation of SMS activity in Amsterdam by designed by Aaron Koblin with the support of urban data mining star Andrea Vaccari. In addition colleague Assaf Bidermann presented the senseable city lab‘s classics (see the a recent program on Discovery Channel for a description of the motivations behind these projects).
InternetActu has a concise report on these 2 presentations (Regarde la ville vivre) that apparently briefly discussed the use of cellphone data to reveal touristic areas (a theme I touch in a paper in the upcoming issue of IEEE Pervasive Magazine). With a less subdued tone, Michiel de Lange (who organized the Mobile City conference this year) provides a very refreshing angle on the session. He argues that quantitative data reduce mobility to mere movements without meaning that does not allow to to get a sense of the city as a lived space and how it is experienced. I find a lot of sympathy in this claim that touches the limitations of hard urban data (they might reveal the “how” but barely assess the motivations of the people who produce the data) and the necessity of the qualitative angle to describe the “why”.
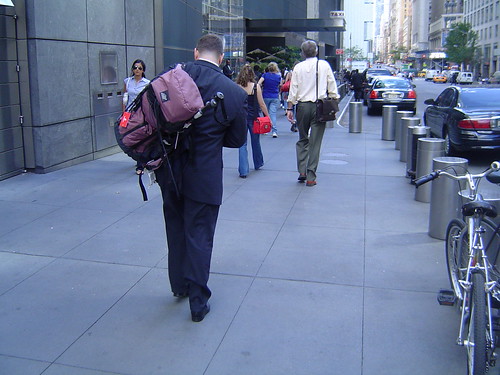
A new urban hiker in Manhattan (the day Lehman Brothers filed for Chapter 11 bankruptcy protection). Quantitative data won’t capture his divergent experience of the city that day.
Relation to my thesis: Discussing the visualization of urban digital footprints seems to be the trend this year (see also José Luis de Vicente’s interview “Visualiser pour discuter et agir” and the upcoming VISUALIZAR’08: Database City workshop he organizes). In 1 years will we actually discuss the analysis of these data and the methods to assess them? My journey as a PhD candidate will be over by then.

Apparently my work on Flickr in Barcelona has been mentioned at Picnic. Photo courtesy of cc. Kandinski
Posted: September 17th, 2008 | No Comments »
Physically anchored by some heavy urban data drilling activities, I could not make the trip to Jeju, Korea for this year’s Lift Asia. Its session on network cities discussed the fusion of digital technologies into contemporary urban environments. Fortunately Nicolas Nova and Bruno Giussani reported their notes. In a follow-up of his the City is Here for You to Use, Adam Greenfield argued that the invisible and intangible overlay of networked information that enfolds in the city is taking over the urban fabrics as drivers to our choices and actions. This becomes particularly true with a long here of layering a persistent and retrievable georeferenced histories and a big now of real-time accessibility to this information at a local and global scale (video of the talk). With the control of these two conditions, networked cities will have the capabilities to respond to the behavior of its residents and other users in like real time, underwriting the transition from browse urbanism to search urbanism. This proposal of the city “à venir” with its new new patterns of interactions echoes very well with Dan Hill’s latest The Adaptive City (follow-up of Sketching the Street of the Near-Future)
These newer nervous systems, not centralised but distributed, and predicated on digital networks of networks in which every object is informational and every movement or behaviour is trackable, could combine to form a new kind of lattice-like informational membrane, hovering magically over the physical fabric of the city. As if one of Calvino’s imaginary cities comprised solely of information, a limitless multidimensional data-based shadow structure represents the life of the city in real-time.
[...]
The built fabric becomes less important than the behaviour of the city itself, and we finally have a sense of the latter. As Reyner Banham suggested all those years ago, services and infrastructure become far more relevant to the way the city feels.
but captured realities networked information feeds back to us only partially correlates the complex reality of a city, as reported in our Real-Time Cities Round Table last Spring and highlighted by Hill:
Not all of the life, of course. There are limits to such models, as there are limits to the perceptive capabilities of sensors and of filters to interpret the data. Real life continues in parallel with the real-time city model. In an inversion of the body, where the human subconscious is capable of processing vast amounts of data not perceived by its conscious self, the real-time city model can only capture a tiny fraction of the information present within the city. So the city information model cannot approach the subconscious of the city, but can provide a facsimile of consciousness.
The model is already being built. With only the simple visualisation of data scraped from the management systems of bike-sharing networks Vélib’ and Bicing we can already see the pulse of the city, Barcelona’s bikes heading to the beach into the sun, whereas their Parisian counterparts saunter from the Périphérique inwards to the centre, mirroring the city’s intrinsic wider rhythms of work and play.
yet these mirrors of the urban reality, even slightly distorted can change the practice of designing cities and their spaces with better/cheaper metrics for post-occupancy evaluations:
Everyday design could become a conversation within social software networks, and citizens have data and tools that urban designers can only dream of. In fact, professional urban designers have this data too, and thus their practice is transformed.
Relation to my thesis: Cities’ evolutions into information spheres, generating wider set of accessible data. Their analysis create novel perspective (or stories as Hill would say) that might affect the way the city sees itself and thus behaves. Ben Cerveny provides in Models of urban dynamics his abstract Look at the way we behave in the real-time city
Yet we are still at a very early stage in which stake holders are actually still not clear on what to do with the data they have been sitting on for years (Données publicques montrez-nous une meilleure voie) and how they could be fed back in a meaningful way.